This week’s FreightWaves Supply Chain Pricing Power Index: 35 (Shippers)
Last week’s FreightWaves Supply Chain Pricing Power Index: 35 (Shippers)
Three-month FreightWaves Supply Chain Pricing Power Index Outlook: 35 (Shippers)
The FreightWaves Supply Chain Pricing Power Index uses the analytics and data in FreightWaves SONAR to analyze the market and estimate the negotiating power for rates between shippers and carriers.
This week’s Pricing Power Index is based on the following indicators:
Volume levels holding on to year-over-year gains, but by a slim margin
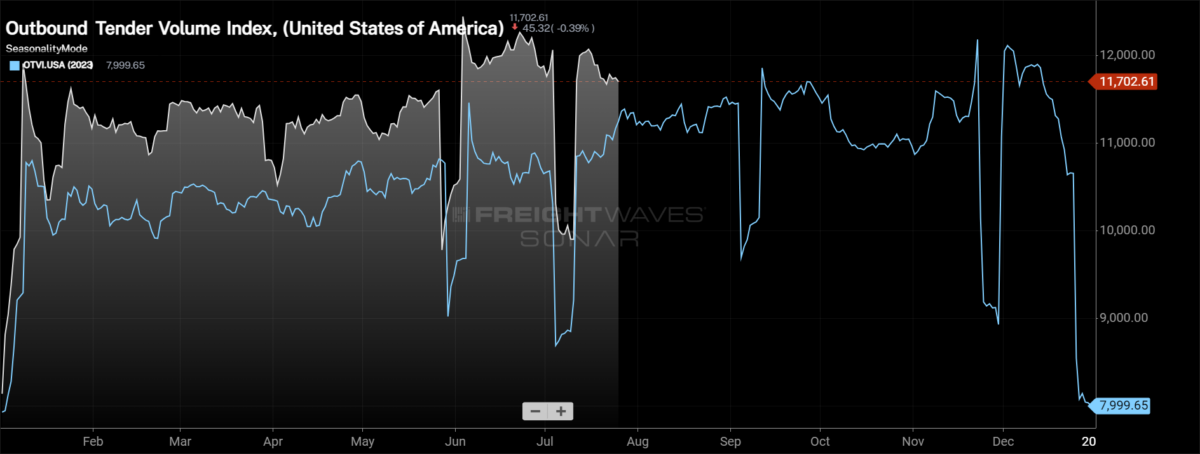
Seasonal trends in volumes are appearing as tender volumes took another breather this week. The downward trend isn’t concerning as July tends to be a softer month for freight, before building momentum into the back half of August ahead of Labor Day. Even with the declines in recent weeks, demand is elevated compared to where it has been throughout much of the year and is holding on to gains year over year.
To learn more about FreightWaves SONAR, click here.
The Outbound Tender Volume Index , a measure of national freight demand that tracks shippers’ requests for trucking capacity, is 1.6% lower week over week as volume levels retreat from the recent high. Since the beginning of July, tender volumes are down just half a percent, which is very different from last year, when volumes gained momentum throughout July before leveling out in August.
To learn more about FreightWaves SONAR, click here.
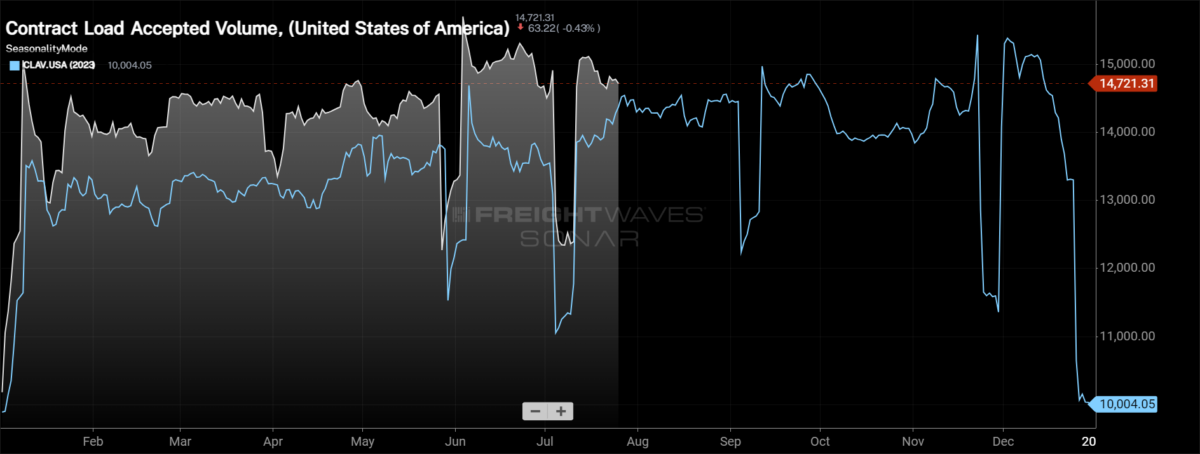
Contract Load Accepted Volume is an index that measures accepted load volumes moving under contracted agreements. In short, it is similar to OTVI but without the rejected tenders. Looking at accepted tender volumes, we see a decrease of 1.24% w/w, erasing all of last week’s gains. At present, CLAV is only up 1.2% y/y, the narrowest spread with 2023 levels since mid-January.
Positive signs for future demand are being signaled, though. Inflation data has been positive for three consecutive months, making a potential interest rate cut in September more likely than it was at the last Federal Open Market Committee meeting. Eyes will be on the FOMC meeting later this week to see if Fed officials signal that interest rates are on the horizon.
If the FOMC decides to cut interest rates in September, it would likely be a boost for investment, especially in the industrial sector of the economy, though it would take some time for those investments to actually be made. Additionally, it would drive some optimism around housing, which would be a boost to freight demand as well.
In Bank of America’s most recent card spending report for the week ending July 20, overall spending remained under pressure. Total card spending was down 0.3% y/y, and excluding autos it was down 0.8%. Much of the decline is attributed to both services (airlines, lodging and entertainment) and goods that have been a drag on spending for much of the year (furniture and home improvement). Online retail spending continues to be a bright spot, up 4.5% y/y, tracking well above year-ago levels coming out of Amazon’s Prime Day.
To learn more about FreightWaves SONAR, click here.
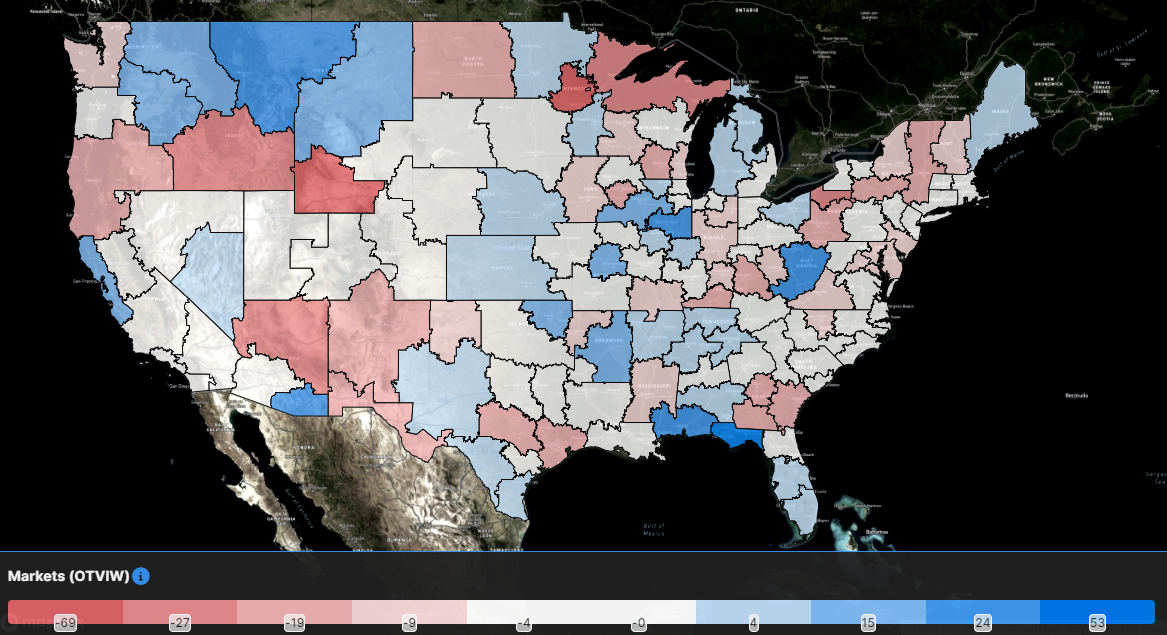
As one might expect when tender volumes decline on the national level, a majority of the markets in the country saw volumes decline over the past week. Of the 135 freight markets within SONAR, 75 experienced lower volumes week over week.
Houston was the largest market that experienced a fairly sizable decrease in tender volumes over the week, falling 16.65%. Even with the decline, tender volumes are elevated compared to where they were for much of the year, apart from late June and early July. If the trend continues, it will be more concerning, but at the moment it appears to be a blip on the radar.
To learn more about FreightWaves SONAR, click here.
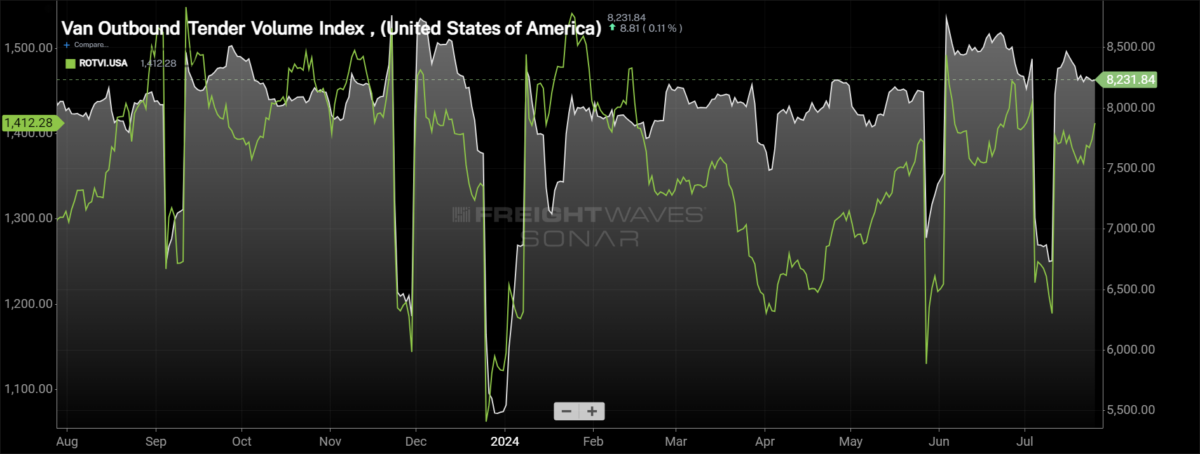
By mode: The dry van market has experienced a slowdown over the past week, but the rate of the decline is starting to taper off. The Van Outbound Tender Volume Index fell by 1.35% w/w. Dry van volumes are nearing an inflection point (and not necessarily a good one) at just 1.11% higher than they were this time last year.
After a sluggish start to July, the reefer market is finding some positives to close out the month. The Reefer Outbound Tender Volume Index has increased by 2.73% over the past week, one of the strongest weekly gains, outside the holiday, in over a month. While van volumes are quickly approaching year-ago levels, the reefer market is widening the gap. Reefer volumes are now up 9.46% y/y.
Rejection rates dip but still above 2019 levels
Capacity continues to exit the market, and that will continue for quite some time as capacity is far slower to react to market conditions than demand is. This reduction, while smaller carriers are exiting, is also appearing in the financials of the largest fleets in the country. Just last week, Knight-Swift, the largest truckload carrier in the country, announced its earnings, and within the report the company had reduced its tractor count in its truckload division by over 2% quarter over quarter.
This decline was expected, as the company’s guidance in its first-quarter release stated, “Truckload tractor count down modestly sequentially into the second quarter before stabilizing for the third quarter.”
In the second-quarter earnings release, the language was largely unchanged, except for the changing of the quarters: “Truckload tractor count down modestly sequentially into the third quarter before stabilizing for the fourth quarter.”
To learn more about FreightWaves SONAR, click here.
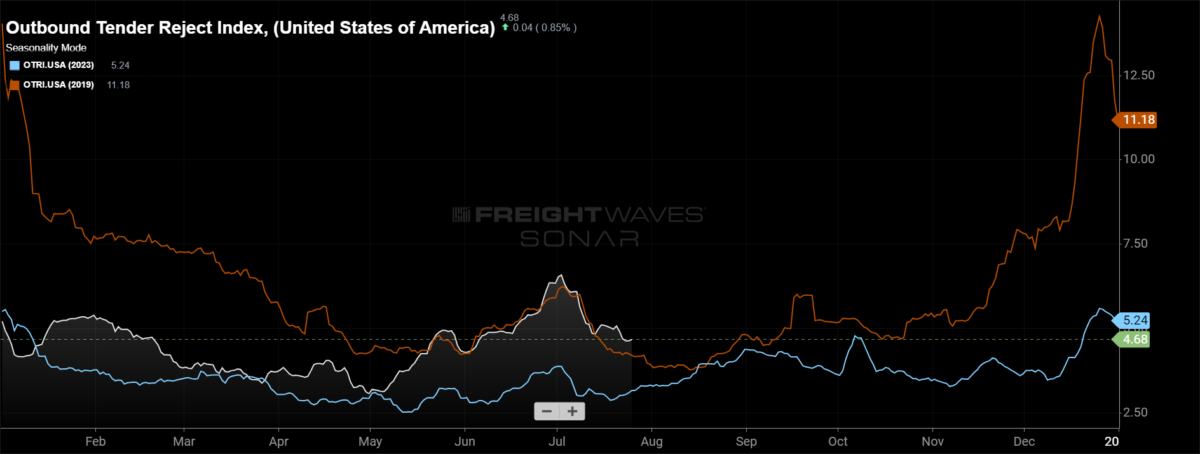
Over the past week, the Outbound Tender Reject Index, which measures relative capacity in the market, continued to inch lower, falling by 35 basis points to 4.68%. Tender rejection rates continue to track slightly above 2019 levels, now 47 bps higher than where they were in 2019. If they continue to follow a similar pattern, rejection rates will fall slightly for the next couple of weeks, before turning higher in the middle of August as the Labor Day holiday approaches.
To learn more about FreightWaves SONAR, click here.
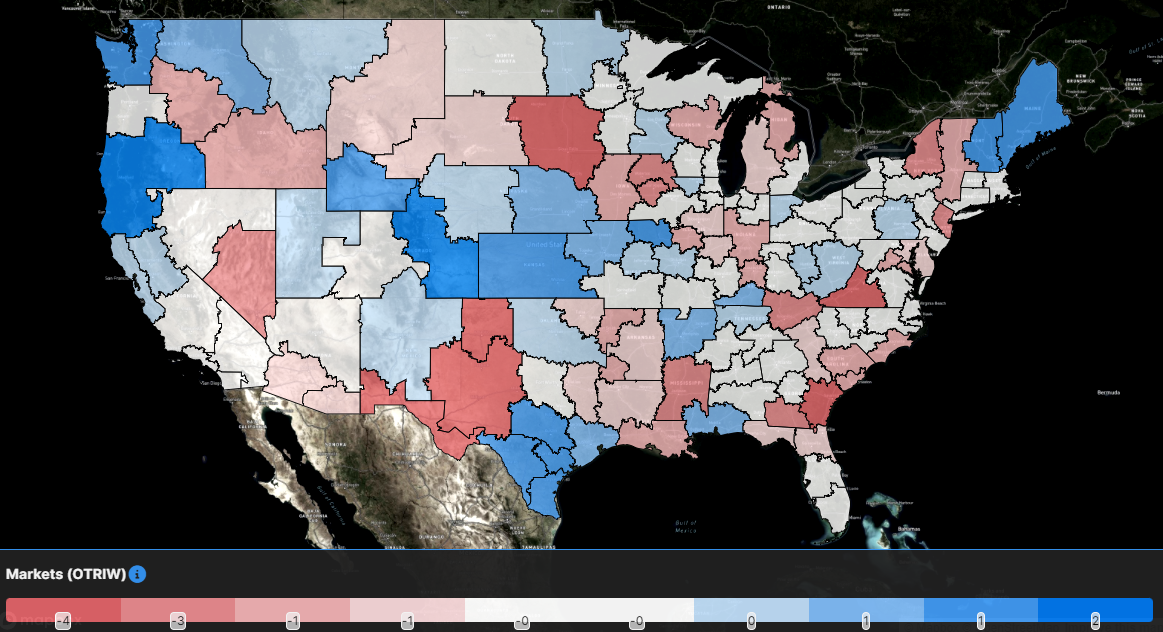
The map above shows the Outbound Tender Reject Index — Weekly Change for the 135 markets across the country. Markets shaded in blue are those where tender rejection rates have increased over the past week, while those in red have seen rejection rates decline. The bolder the color, the larger the change in rejection rates.
Of the 135 markets, only 46 reported higher rejection rates over the past week, down from 65 last week as the ebbs and flows of truckload capacity continue to appear.
The Gulf Coast is experiencing rejection rate increases, with Houston, the largest market, seeing a 156-basis-point increase week over week to 7.67%. Rejection rates in Harrisburg, Pennsylvania, also picked up steam in the past week, rising 63 basis points, but they are still under 4%.
To learn more about FreightWaves SONAR, click here.
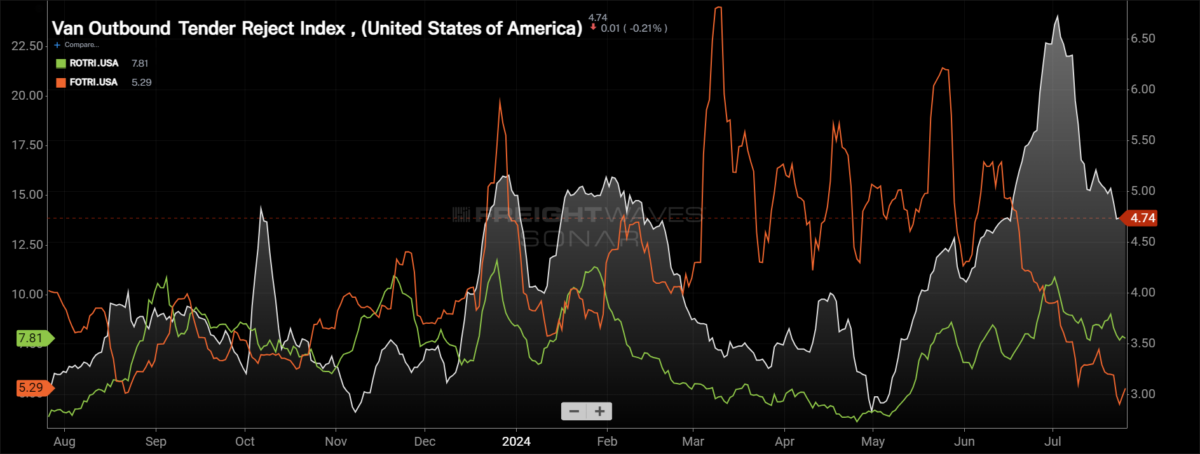
By mode: Dry van capacity remains the loosest of the equipment types, which isn’t a surprise given the relative ease of entering the market. The Van Outbound Tender Reject Index fell by 29 basis points over the past week to 4.74%, in line with 2023 holiday-like levels.
Reefer rejection rates suffered a larger decrease over the past week but have been arguably the most stable of the equipment types in July. The Reefer Outbound Tender Reject Index fell by 86 bps over the past week to 7.81%, in line with where they were throughout the back half of 2023.
The flatbed market remains under pressure as flatbed rejection rates have fallen to the lowest level in the past year. The Flatbed Outbound Tender Reject Index dropped by 82 bps over the past week to 5.29% as flatbed rejection rates have been cut in half in just over a month.
Spot rates keep falling but are still higher than they’ve been most of the year
Following the holiday, spot rates have continued to retreat into the final week of July. While this was expected, one thing that may go unnoticed is that the pressure on spot rates that appeared around International Roadcheck in mid-May has helped keep spot rates elevated relative to the rest of the year.
To learn more about FreightWaves SONAR, click here.
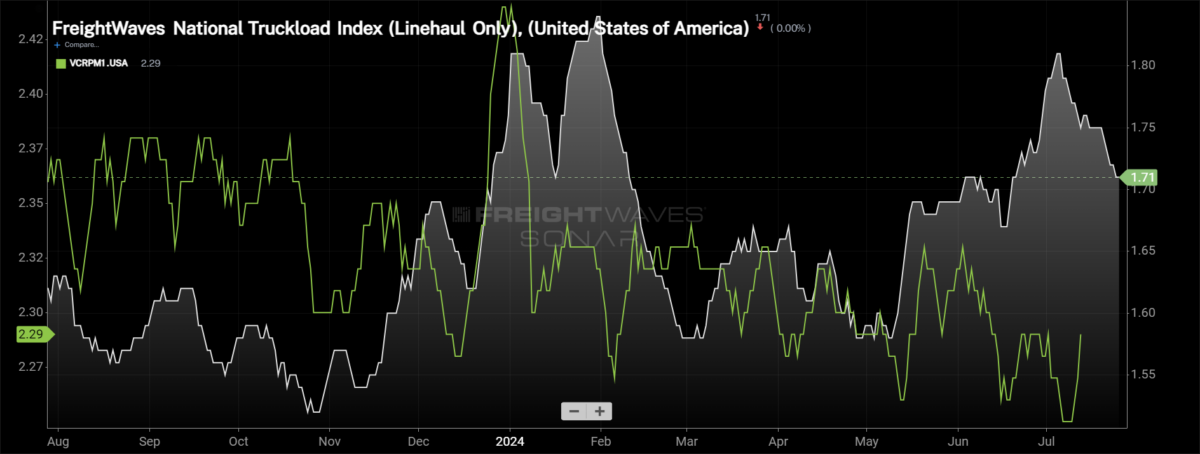
This week, the National Truckload Index — which includes fuel surcharge and various accessorials — fell 5 cents per mile to $2.30 and was only down 3 cents per mile from where it stood last month leading into the Fourth of July holiday. Compared to this time last year, the NTI is up 7 cents per mile (or 3.1%). Linehaul rate declines were slightly smaller than the decline in the NTI, as the linehaul variant of the NTI (NTIL) — which excludes fuel surcharges and other accessorials — fell by 4 cents per mile w/w to $1.71, down 3 cents per mile from where it was this time last month and 9 cents per mile higher than it was at this time in 2023.
For many, cost savings from transportation have already been felt, and the key in contract negotiations is turning to service. Over the past year, the initially reported dry van contract rate (VCRPM1.USA), which excludes fuel surcharges and accessorials, has fallen by 12 cents per mile to $2.29. But since November, VCRPM1 has been within a 9-cent-per-mile range, excluding the holidays, signaling that while many are still looking for aggressive rate reductions, the overall market has stabilized.
To learn more about FreightWaves SONAR, click here.
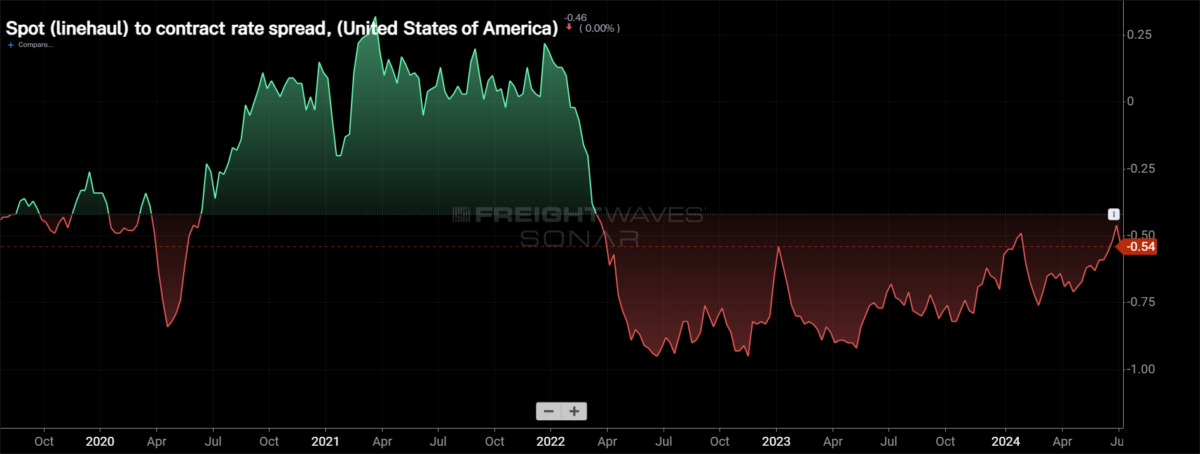
The chart above shows the spread between the NTIL and dry van contract rates is trending back to pre-pandemic levels. The recent widening of the spread is attributed to the decline off the recent highs for spot rates and a subtle bounce-back in contract rates. As the spread approaches pre-pandemic levels, the market will feel tighter, especially compared to the past two years.
To learn more about FreightWaves TRAC, click here.
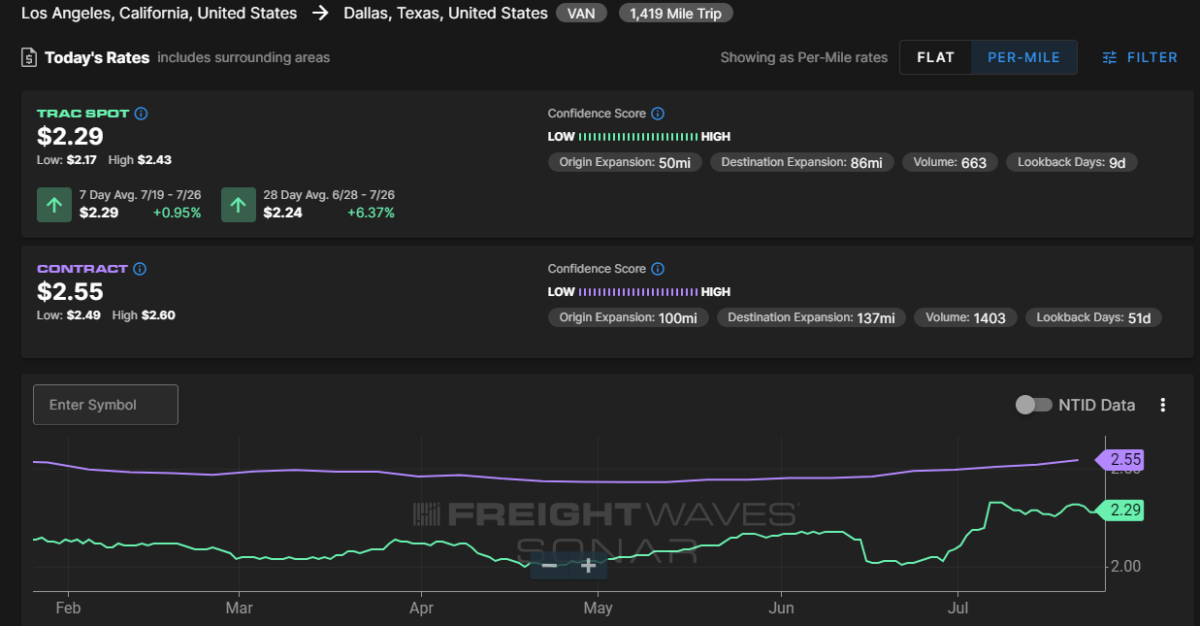
The FreightWaves Trusted Rate Assessment Consortium spot rate from Los Angeles to Dallas has been surprisingly stable since the Fourth of July holiday, considering the decline in the NTI. The TRAC rate from Los Angeles to Dallas increased by 1 cent per mile to $2.29 over the past week and is 26 cents below the contract rate in this lane.
To learn more about FreightWaves TRAC, click here.
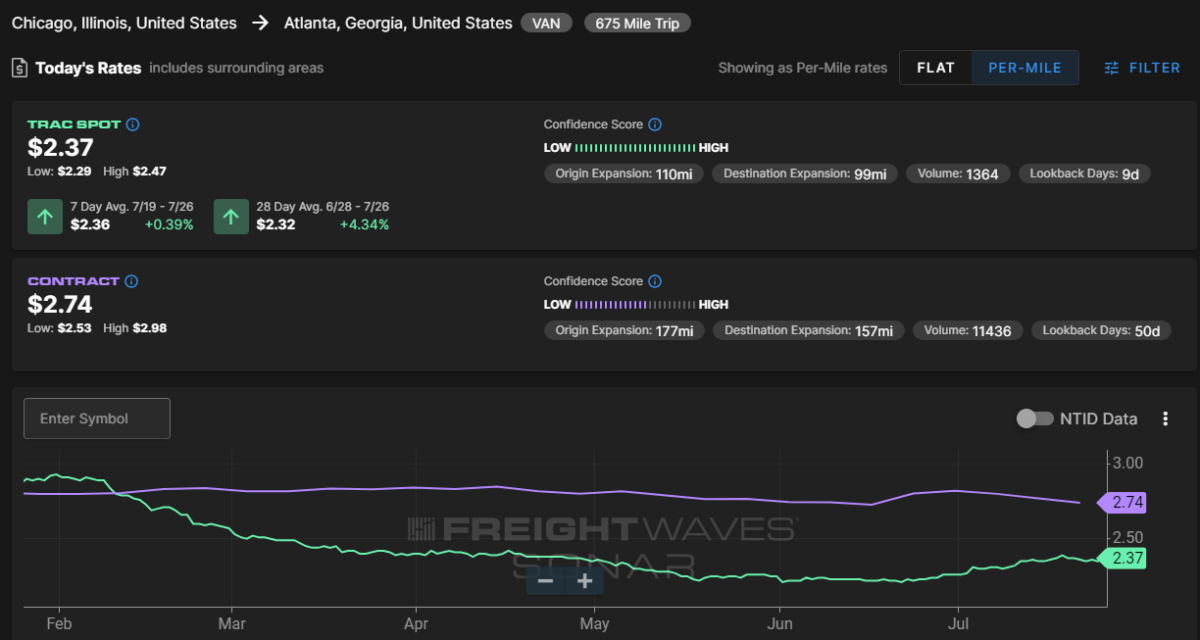
From Chicago to Atlanta, the TRAC rate has started to slide ever so slightly after building momentum throughout late June into the middle of July. The TRAC rate from Chicago to Atlanta fell by 2 cents per mile over the past week to $2.37 per mile, 37 cents per mile below the contract rate.


