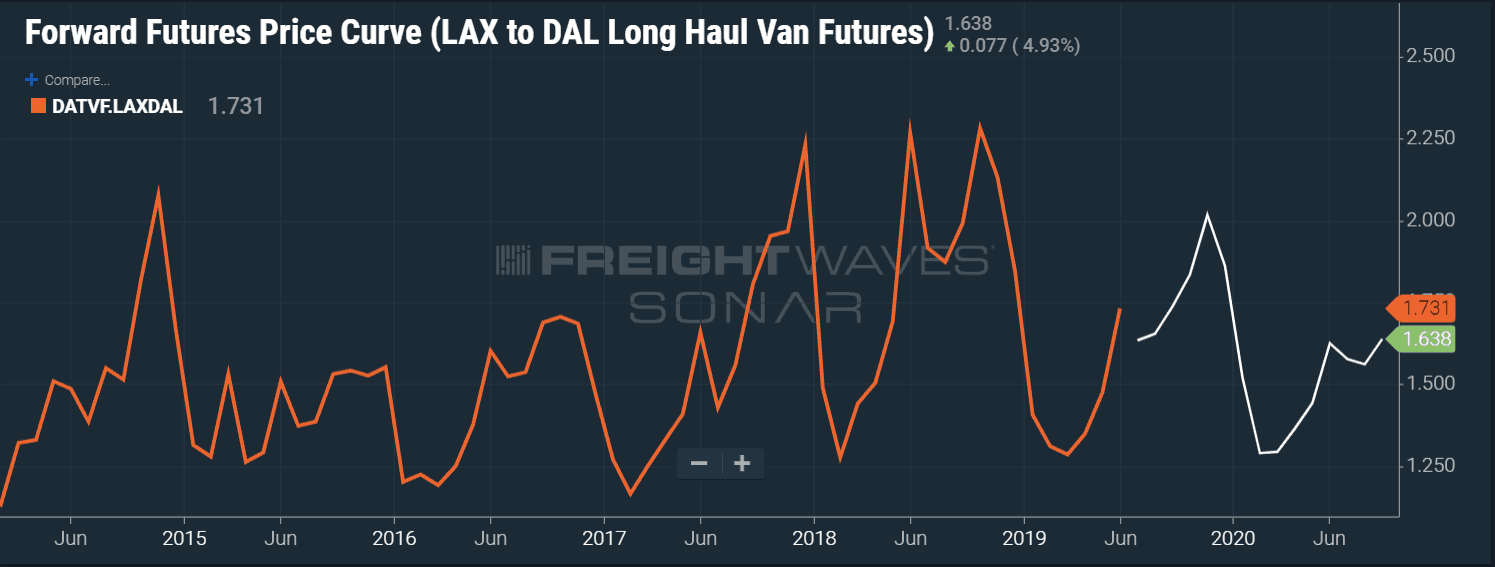
The Trucking Freight Futures forward curve for the Los Angeles to Dallas contract (FWD.VLD) calls for a muted peak retail season for the last quarter of 2019. The market expects spot prices on that lane to be lower than in 2018 or 2017, peaking at around $2.01 per mile in November.

The futures market expects 2019 to have a stronger finish than 2015 or 2016, but note that peak season contracts have been bid down in the past few weeks, with December 2019 futures falling 13 cents. In other words, as more information enters the futures market – like the final magnitude of the summer surge, and more port data in September and October – the $2.01 peak may not be realized. The forward curve represents market expectations at this particular moment in time.
The L.A. to Dallas lane is the heartbeat of the United States’ national freight network, connecting the largest container ports in the continent to a major city in the interior. It’s also one of the highest volume and most volatile lanes, pulling national average spot prices up and down with it.
“Los Angeles to Dallas is off 16 percent from last year,” said Kyle Lintner, principal at K-Ratio, a Chicago-based firm that offers risk management solutions to shippers, brokers and carriers, including Trucking Freight Futures. “If you look at the national average against Los Angeles to Dallas, you’ll see the two move in tandem.”
That correlation broke down at the end of 2018, as a rapid climb in Los Angeles to Dallas spot rates that took the lane to $2.43 per mile did not materialize in a national average move. The tightness experienced in southern California at that time was attributed to freight pulled forward to avoid tariffs on imports from China. That disruption is unlikely to be repeated this year as President Trump and President Xi apparently agreed to de-escalate the trade war at last month’s G20 meeting in Japan.
“Last year’s extreme spike didn’t move the market with it – there was a bifurcation,” Lintner explained. Lintner went on to predict a sub-$2 per mile peak for the Los Angeles to Dallas lane by the time the contracts were settled, saying that even if Los Angeles heats up, it will be flooded by trucks looking for favorable rates and opportunities to utilize their assets.
“It’s like whack-a-mole: whichever lane pops up is going to get smacked down,” Lintner said.
Trucking is not the only mode affected by weaker volumes. Air cargo spot rates from Hong Kong to North America are at $3.52 per kilogram (AIRUSD.HKGNOA), down 7.3 percent year-over-year.
Last week’s rail volumes contracted 5.3 percent year-over-year, a sequential improvement from the four week trend of a 6.2 percent year-over-year decline. Although intermodal, which competes with trucking, accounted for much of the drop, falling 7.4 percent year-over-year, coal volumes decreased by 5.2 percent and grain contracted 10.9 percent.
Container lines’ recent general rate increases (GRI) on the Transpacific lane appear to be holding up fairly well. The July 1 hike that brought rates up to $1,680 per box from China to the West Coast (FBXD.CNAW) has deteriorated to $1,664 as of July 8. FreightWaves expects this GRI to hold and then slide slightly through the month end.
“They like to hit you hard and then see where the market really is,” said Henry Byers, FreightWaves market expert on freight forwarding and maritime. “The steamship lines normally file the rate with the FMC in the $800-$1000 range, then when it is actually implemented they go down to around $450-550, but by the time the first week of bookings start rolling in after the GRI, it normally settles around $250-350 depending on the month.”
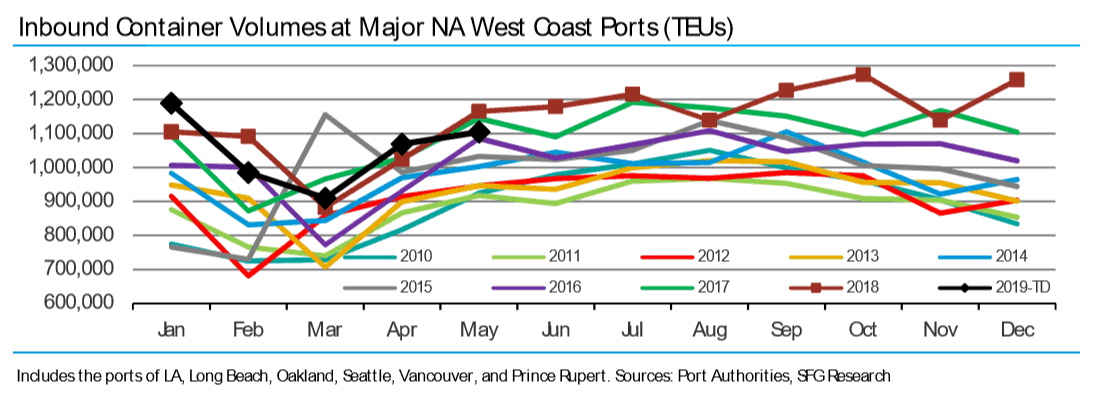
Container volumes into North American West Coast ports are still trending below both 2018 and 2017, closely tracking trucking spot prices out of southern California.

Ultimately, the strength of the retail holiday season will depend on consumer behavior. According to the Organisation for Economic Cooperation and Development (OECD), the United States’ consumer confidence index has been on a steep upward trend since January 2019, when it bottomed at 100.86. Any score above 100 signals consumers’ confidence toward the future economic situation and a willingness to reduce savings rates and spend more money. In May, the consumer confidence index for the U.S.reached 101.71, somewhat above Europe at 100.02.
So far this year, retail spending has grown at a healthy clip. June’s better-than-expected jobs report should also bolster spending, but it remains to be seen whether these trends will hold up into peak retail season.


