


This week’s FreightWaves Supply Chain Pricing Power Index: 35 (Shippers)
Last week’s FreightWaves Supply Chain Pricing Power Index: 35 (Shippers)
Three-month FreightWaves Supply Chain Pricing Power Index Outlook: 35 (Shippers)
The FreightWaves Supply Chain Pricing Power Index uses the analytics and data in FreightWaves SONAR to analyze the market and estimate the negotiating power for rates between shippers and carriers.
This week’s Pricing Power Index is based on the following indicators:
Tender volumes close August higher than where they began
After the sluggish start to August, tender volumes have been trending higher throughout the month. August will follow a trend similar to last year when tender volumes will close the month higher than they began the month. With import levels still being extremely elevated, eventually the freight will move to the truckload market, it is more a matter of timing of when that happens.
To learn more about FreightWaves SONAR, click here.
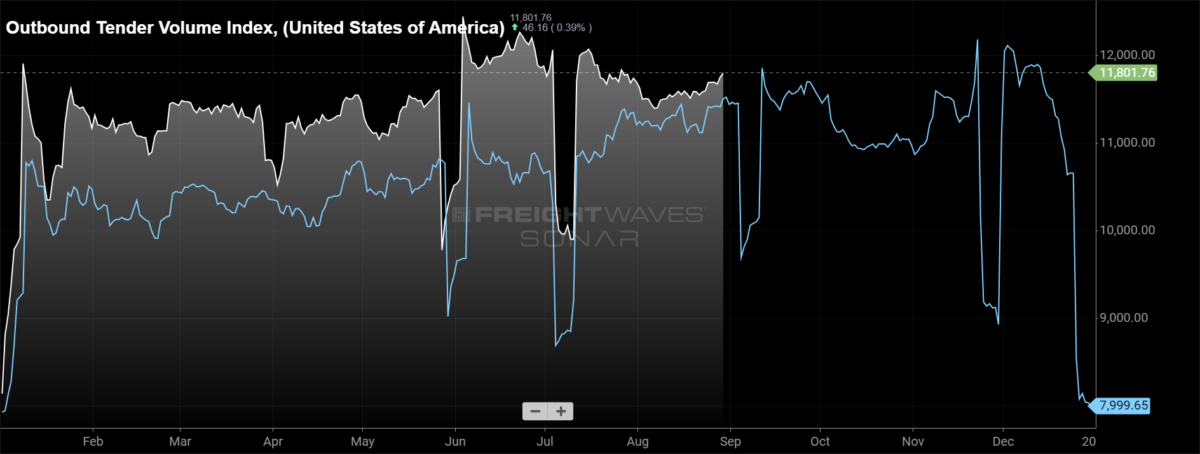
The Outbound Tender Volume Index, a measure of national freight demand that tracks shippers’ requests for trucking capacity, is 1.87% higher week over week, the largest increase since the impacts of Fourth of July. The gap with year-ago levels rebounded over the past week as volumes continued to inch higher. Volumes are currently 3.13% higher year over year.
To learn more about FreightWaves SONAR, click here.
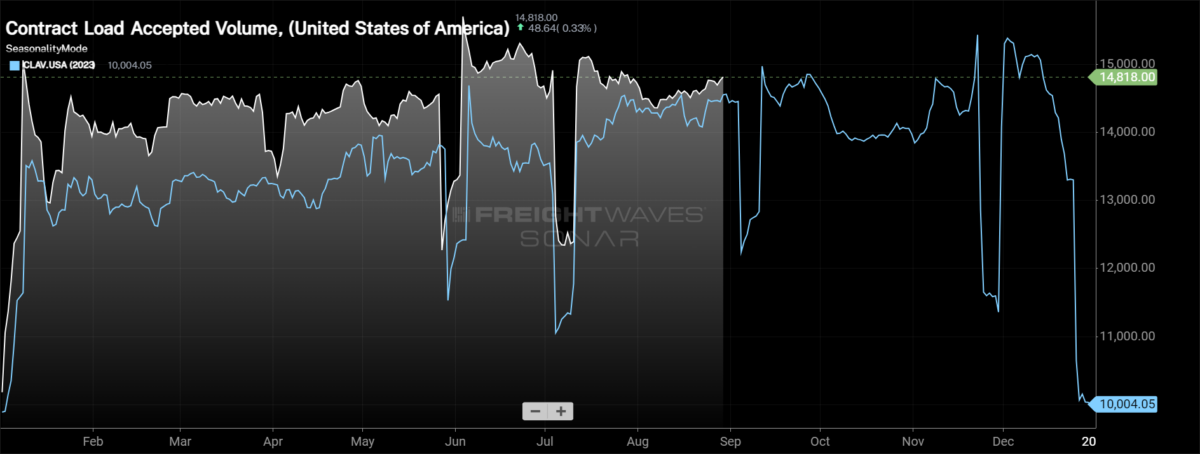
Contract Load Accepted Volume (CLAV) is an index that measures accepted load volumes moving under contracted agreements. In short, it is similar to OTVI but without the rejected tenders. Looking at accepted tender volumes, we see an increase of 1.39% w/w, a slightly smaller increase than OTVI as tender rejection rates moved higher over the past week. Accepted tender volumes are up 1.41% y/y.
Earnings reports in the retail space have continued to show that comp sales remain challenged, but retailers have been able to control costs extremely well. A prime example of this was at Best Buy, a company that needs strong discretionary spending for electronic purchases. In the company’s second quarter earnings release, comparable sales declined by 2.3%, but the company’s non-GAAP diluted EPS was 9.8% higher y/y.
With the increase in imports, it appears that retailers, especially big box retailers, are expecting a strong fourth quarter from a consumer spending perspective.
To learn more about FreightWaves SONAR, click here.
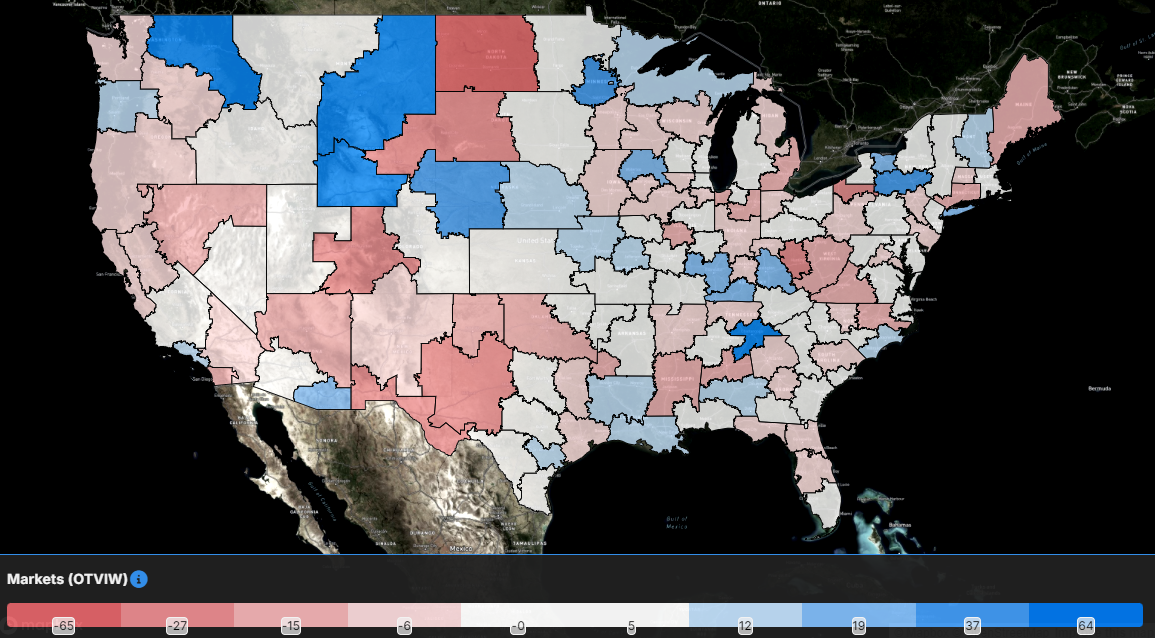
Volume increases took hold across the majority of the country as 74 of the 135 freight markets tracked within FreightWaves SONAR showed week-over-week increases in volumes.
Even with the uptick in volumes over the past week, the largest freight markets in the country experienced tender volumes decline. Tender volumes in Ontario, California fell by 0.69% w/w. Moving east into Dallas, tender volumes were 1.37% lower w/w. In the southeast, the decline was even more severe as tender volumes in Atlanta fell by 4.04% w/w.
To learn more about FreightWaves SONAR, click here.
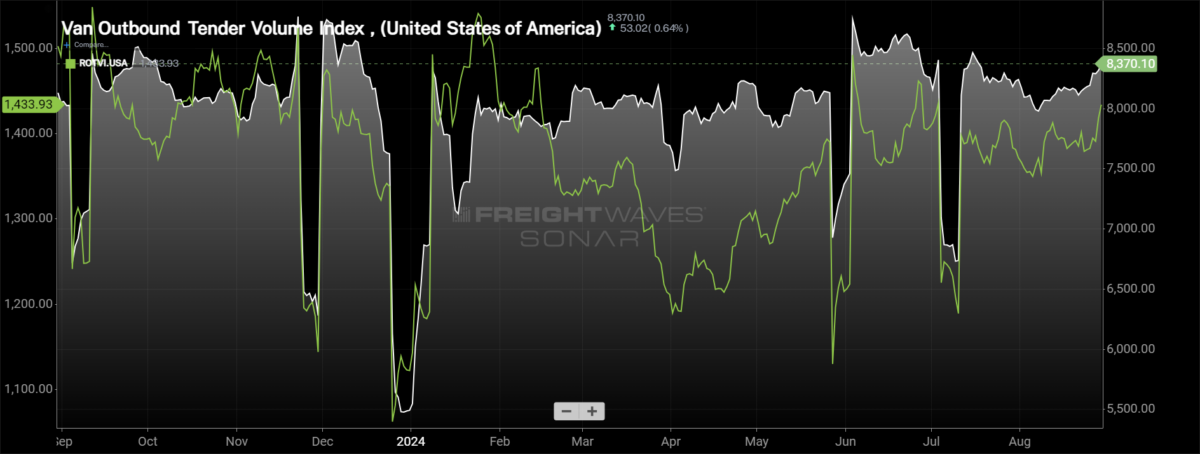
By mode: Dry volumes are now almost up to Fourth of July volumes, which is a positive as August comes to a close. The Van Outbound Tender Volume Index increased by 2.76% w/w. Dry van volumes are 3.93% higher y/y, as the gap with 2023 levels continues to widen after coming in line with 2023 levels in early August.
The reefer market continues to show that it is trending higher, but with more hiccups along the way. Over the past week, the Reefer Outbound Tender Volume Index increased by 2.31%. Despite the weekly increase, reefer volumes are still down 3.82% y/y.
Rejection rates inch higher for Labor Day weekend
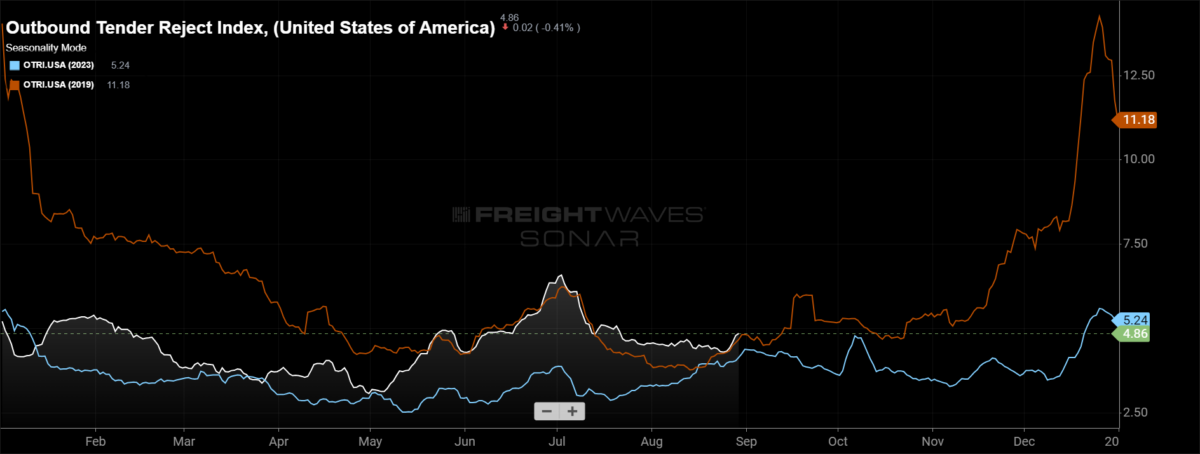
Tender rejection rates have reacted to the Labor Day holiday weekend, but the reaction has been fairly muted in comparison to the Fourth of July holiday week. Tender rejection rates moved higher over the past week, approaching 5%, but that’s over 200 basis points lower than the Fourth of July peak.
To learn more about FreightWaves SONAR, click here.
Within the past week, the Outbound Tender Reject Index (OTRI), which measures relative capacity in the market, increased by 45 basis points to 4.86%. The increase was the largest weekly increase since the Fourth of July holiday and very similar to the increase leading into Labor Day last year. Tender rejection rates continue to run slightly higher than they were this time last year, currently 47 basis points higher y/y. Compared to 2019, the year in which the current direction aligns with the most, tender rejection rates are currently 18 bps higher.
To learn more about FreightWaves SONAR, click here.
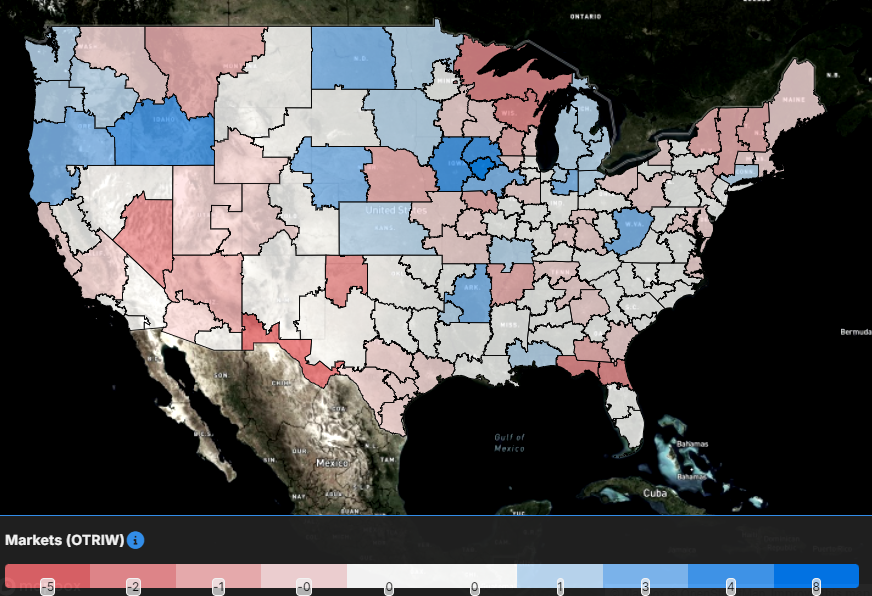
The map above shows the Outbound Tender Reject Index — Weekly Change for the 135 markets across the country. Markets shaded in blue are those where tender rejection rates have increased over the past week, while those in red have seen rejection rates decline. The bolder the color, the more significant the change.
Of the 135 markets, 96 reported higher rejection rates over the past week, an increase from 76 in last week’s report.
The Detroit, Michigan market experienced the largest increase in tender rejection rates of the largest freight markets. Tender rejection rates in Detroit increased by 169 bps w/w.
The Pacific Northwest is seeing rejection rates increase over the past week, including Seattle where rejection rates were 204 bps higher w/w.
To learn more about FreightWaves SONAR, click here.
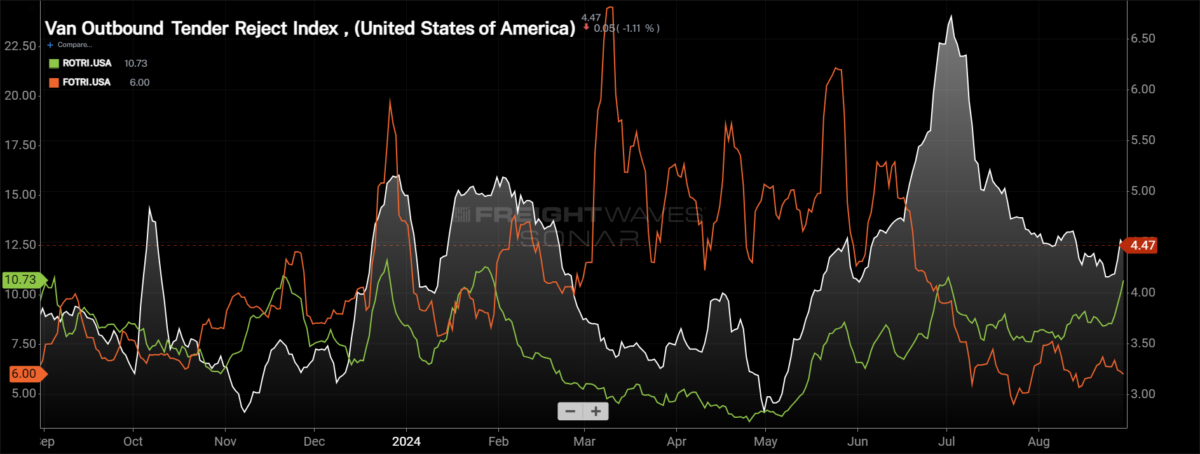
By mode: Dry van rejection rates did move higher over the past week, but haven’t eclipsed the levels experienced earlier in August. Over the past week, the Van Outbound Tender Reject Index rose by 18 bps to 4.47%. Dry van rejection rates are 62 bps higher than they were this time last year.
The reefer market is being far more volatile than the dry van market as reefer rejection rates are on the rise. The Reefer Outbound Tender Reject Index has increased by 230 basis points to 10.73%. Reefer rejection rates are 57 basis points higher than they were this time last year.
Flatbed rejection rates continue to be under pressure, largely due to the higher interest rate environment. With interest rate cuts on the horizon, it is likely that the last four months of the year will see some muted activity until industrial and manufacturing companies deploy capital that has been on the sidelines. Over the past week, the Flatbed Outbound Tender Reject Index fell by 87 basis points to 6%. Flatbed tender rejection rates are 68 basis points lower y/y, as the higher interest rate environment had a lagging impact to the market.
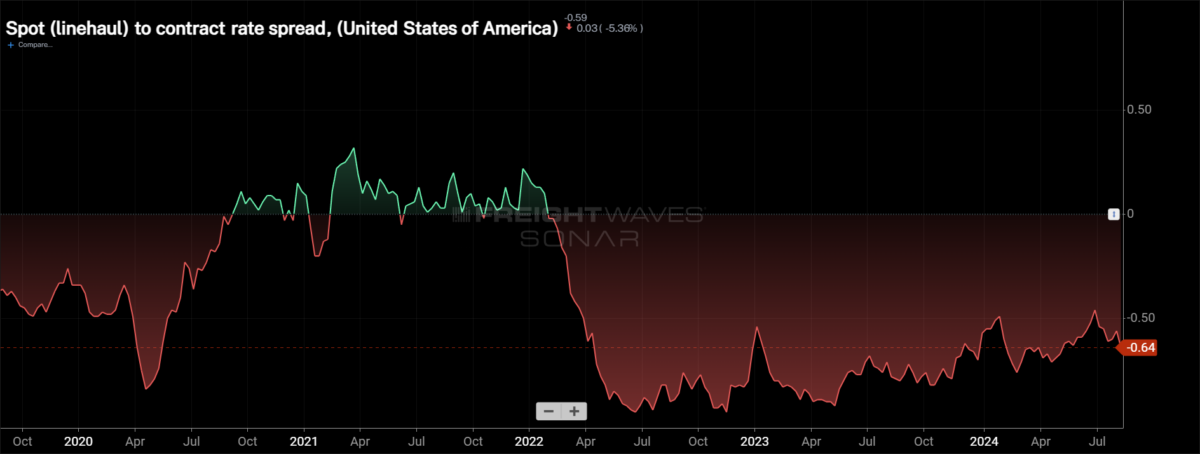
Spot rates have limited movement into Labor Day
Spot rates have leveled out at Memorial Day holiday levels, which is a positive sign for the market moving into the final stanza of the year. At the same time, contract rates have been moving higher since late June, which signals that significant cost savings have already been realized.
To learn more about FreightWaves SONAR, click here.
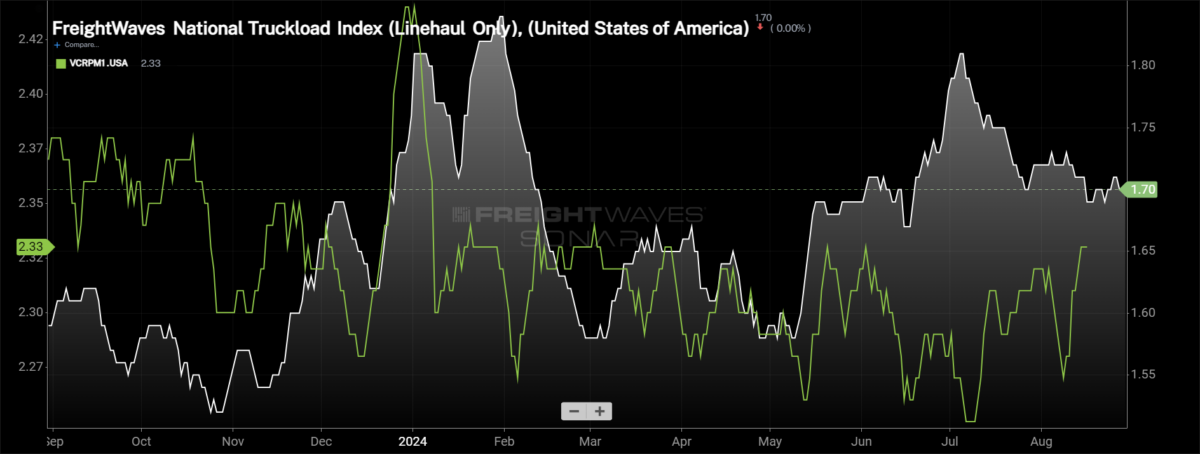
This week, the National Truckload Index (NTI) — which includes fuel surcharge and various accessorials — was unchanged over the past week at $2.27 per mile. Compared to this time last year, the NTI is up 1 cent per mile. The linehaul variant of the NTI (NTIL) — which excludes fuel surcharges and other accessorials — was up 1 cent per mile this week at $1.70. The NTIL is 12 cents per mile higher than it was at this time last year. The discrepancy in the NTIL and NTI is solely the changes in fuel, which was far more expensive in 2023 than currently. The average diesel truck spot price per gallon is 73 cents per gallon, or 16.4%, lower than it was last year.
Initially reported dry van contract rates remain in a fairly tight range, increased by 5 cents per mile over the past week at $2.33. Throughout 2024, contract rates have been in a tight range, an indication that the extreme cost savings are in the rearview mirror and service is now coming to the forefront. Initially reported contract rates are down 5 cents per mile from this time last year, about a 2% decline.
To learn more about FreightWaves SONAR, click here.
The chart above shows the spread between the NTIL and dry van contract rates is trending back to pre-pandemic levels. The spread widened over the past week as van contract rates increased while spot rates were fairly stable. If spot rates move higher over the next week as any disruption from the Labor Day holiday works itself out, it will narrow the spread.
To learn more about FreightWaves TRAC, click here.
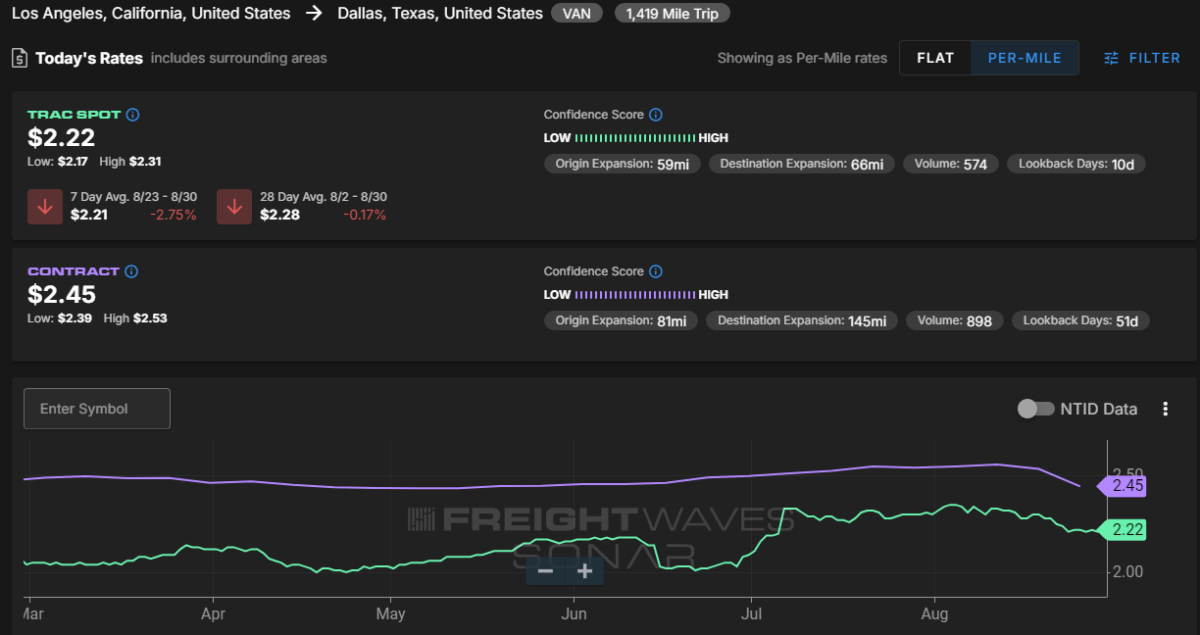
The FreightWaves Trusted Rate Assessment Consortium spot rate from Los Angeles to Dallas fell by 2 cents per mile over the past week to $2.22 per mile.
To learn more about FreightWaves TRAC, click here.
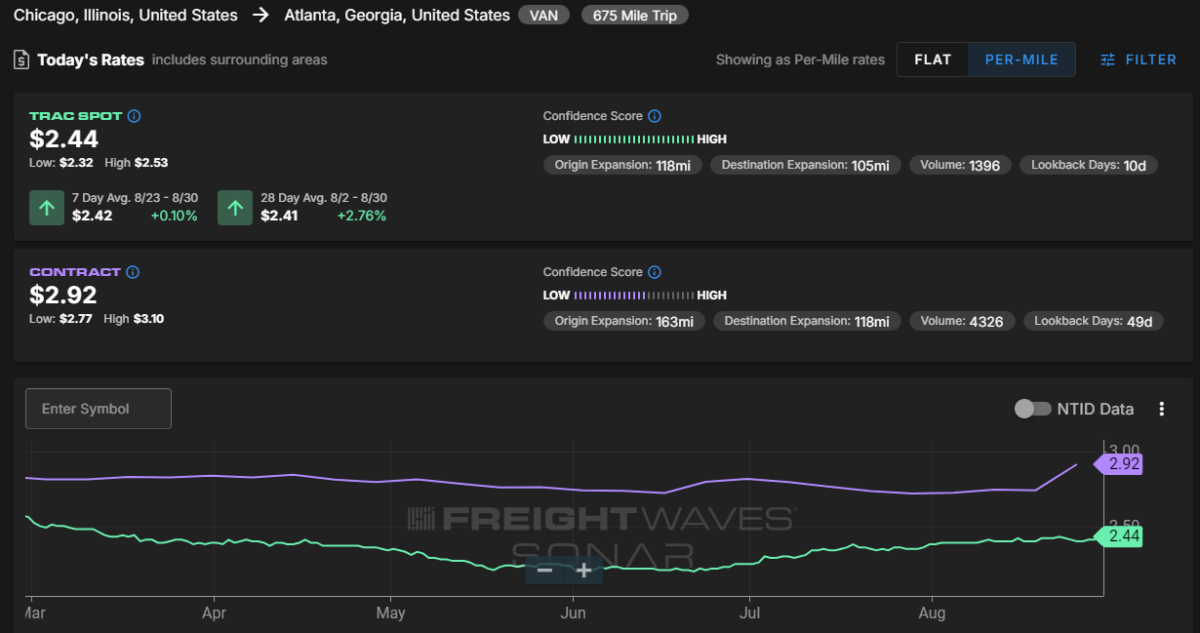
From Chicago to Atlanta, the TRAC rate was stable over the past week, remaining at $2.44 per mile. Contract rates along this lane increased at the start of the week, widening the spread to nearly 50 cents.