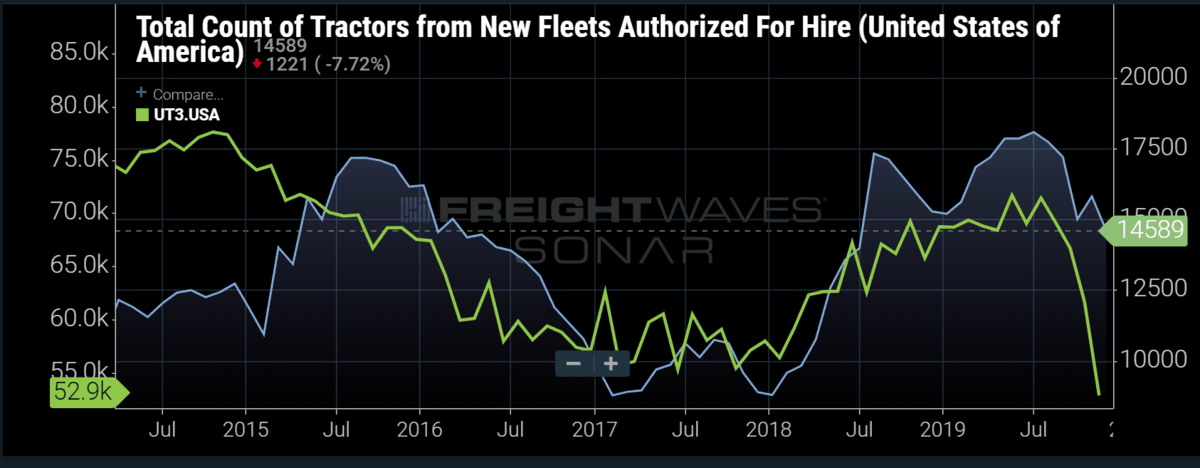
Chart of the Week: Total Count of Tractors from New Fleets Authorized for Hire, Used Truck Prices – 3 Year Old SONAR: TCFHN.USA, UT3.USA
Smaller fleets and new carrier growth have stalled according to the Federal Motor Carrier Association (FMCSA) data counting the number of tractors assigned to new for-hire fleets. Tractor count growth from new fleets started falling from a multi-year high of 9,559 trucks in July 2019 to 7,876 in November 2019. Used truck prices for class 8 trucks supports this by plummeting by almost $20K over the past six months.
Used truck prices are a good barometer for new and smaller fleet growth due to the fact many of the 500+ truck carriers have a large enough credit line to purchase new equipment and maintain a lower average aged fleet. New operators and smaller fleets that have not established a strong line of credit or have ample cash typically purchase older equipment, which is dramatically discounted off the initial sticker price.
A new Freightliner Cascadia — a common fleet truck — typically runs $150K+, while the average used truck price for a 3-year old truck over the last year runs around $63K. From July through November, the average price of a 3-year old used truck has fallen from $71,400 to $52,860 — an indication that demand has dropped quickly for used trucks.
Trucking is an extremely saturated market, with numerous players competing for limited freight. Over 93% of the fleets registered for operation in the U.S. have less than 20 trucks. The fleet count is important because each fleet represents a unit of competition, whereas tractor counts are an indication of overall capacity. Trucks within the same fleet do not compete with each other on price. When new operators enter the market, that means there is more competition, which puts downward pressure on shipping rates.
The overarching story-line for the freight market in 2019 was how far removed it was from the previous year. Soaring spot market rates in 2017-18 pulled contracted rates through the typical 0-4% annual increase threshold as carriers feasted on the opportunity to make more than pennies on the dollar for every transaction. Many operators took this opportunity to expand their fleets or start their own venture as owner-operators.
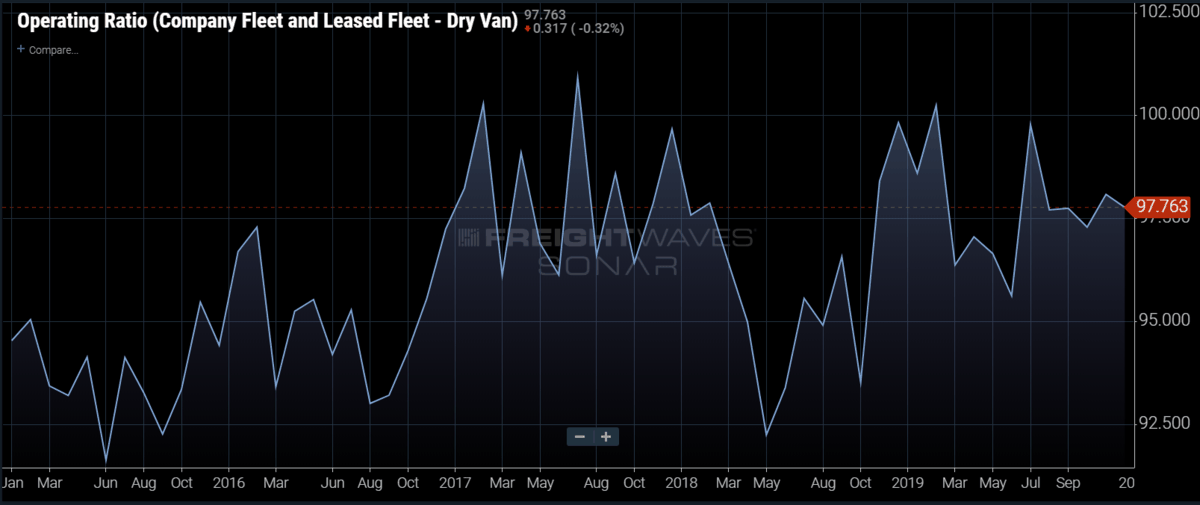
The trucking industry is notorious for having low margins. The average dry van carrier in the Truckload Carrier’s Association (TCA) profitability program averaged a 98% operating ratio in the 4th quarter, meaning for every $100 they made they spent $98 to operate or made $2 in margin to spend on either debt or reinvest in the company. When there is a rapid expansion in rates, such as in 2018, cash flows expand, and supply rises to meet demand.

Low barriers to entry in the trucking sector make it relatively easy for a driver to buy equipment and start hauling freight, unlike many other industries that require significant investment to enter the space.
Looking into 2020, the hangover from a soft 2019 will have the reverse effect of a strong 2018 as supply will inevitably fall to meet demand. Increasing costs outside of equipment, such as insurance and maintenance, and lower margins will make it more difficult for independent operators to enter the market.
About the Chart of the Week
The FreightWaves Chart of the Week is a chart selection from SONAR that provides an interesting data point to describe the state of the freight markets. A chart is chosen from thousands of potential charts on SONAR to help participants visualize the freight market in real-time. Each week a Market Expert will post a chart, along with commentary live on the front-page. After that, the Chart of the Week will be archived on FreightWaves.com for future reference.
SONAR aggregates data from hundreds of sources, presenting the data in charts and maps and providing commentary on what freight market experts want to know about the industry in real time.
The FreightWaves data science and product teams are releasing new data sets each week and enhancing the client experience.
To request a SONAR demo click here.


ThagearJammer25/8
Ohh the writings been in the wall all right. Good talent always finds a way and it sounds like you’ve got a good gig! I’m happy for you. Il be working those loss leafs! Tell I can’t… It’s tried and true. A guy can play the weather the traffic and Enjoy the day. Heck sleep when he’s tired! Grab a decent park. Can’t expect nobody to do a big job fast! Hate to see ppl quite or roll over…. unfortunately the old timers have given up. do u have the soul of a slave??? Or a free man??? As a slave throws his hands in the air and says what can I do for I’m just a. Where as a free man looks at life as a series of problems needing to be solved. We are the government never forget that!
Mike
Currently I am free, I broke the yoke of the truck and am moving on to hopefully bigger and brighter things… As far as doing something? I have written letters, replied to the federal register, etc. Like most all of us out here, I have come to the conclusion that no one is listening. So, it was an easy decision, as this industry left me, I did not leave it. Time to move on.
Dave
Carriers were dancing in the streets in 2018 and loving life and making cash. During 2019 many of those same people were losing money a complaining about the free market.
It appears views change quickly on regulations depending on how much money is in your pocket.
Mike
Dave, this has been coming for quite awhile. These inflexible HOS and the new game we play with this unstoppable clock has been enough for most of us old timers out here, the straw that broke many a camel’s back. And then throw in the insurance, diesel, parts, service, everything is going up as the rates are not.
I have lived through the good and bad years, 31 years I think I have seen enough to finally say enough is enough. The equipment is crap and unreliable, the rates are actually less than when I started back in the late 80’s, I did not have foreigners to compete with that run their entire operations from overseas, a group that has no skin in the game, I cannot compete with that 1099 crew. Inflexible HOS that take nothing into account out here and to add insult to injury they put a stop watch on my dash.
Say or think what you want about me, I have earned the right to say this industry is out of control and needs to be reined in and that I have personally had enough. You will eventually figure it out, because the writing is on the wall, and sadly, no one is paying any attention.
Dave
Mike, I apologize. I read your posts above. It’s easy for us desk guys to say stuff we know little about. My guys run short haul and it’s a different model. Reading above I can truly feel your pain. God bless you my brother. I hope the new job works out and you can replenish those lost savings.
Mike
Thanks Dave.
Mike
Yes, too easy to buy a truck and gain operating authority. We have no guardrails, the market is beyond saturated with trucks and drivers. Deregulation has not been good for this industry, as we are now out here eating each other and going broke, With expenses going through the roof, the garbage equipment, thanks EPA, and the influx of the third world, it was not a difficult decision to park the truck for good.
ThaGearJammer25/8
What were you thinking last year!??
Ive had a very profitable month. Gotta strategize and have a feel for the industry. Sure it’s changing but sometimes that’s the most profitable times. treat It as a low margin penny business. Chaos. Deregulation Was a blessing. Crony capitalism isn’t good. Hoping to hang on because as im sure you are aware after deregulation is how we got most of the “Mega” carriers of today. A well run business should (we hope) always have opportunities we don’t want state or government interference.
Mike
I could have done a few things, I still have friends out here making some money, but it comes and goes, and that is the issue, it is a continual boom and bust that runs month to month. One good month does not make for a good year.
It’s been 31 years out here more myself, going on 32, and I honestly no longer see this being a viable way to make a living. I have no savings left, those are all gone in truck repairs, downtime, slow times and general life expenses.
Then we have the ELD, that has been an incredible drain, my stress level is through the roof as is my fuel bill as I now speed to play “Beat the Clock”. And my driving, I am now speeding, something I never did, then the added stress, I am now making stupid mistakes. I’ve been doing this safely for over 30 years, and now you want to time me? Brother, I fudged, I have always fudged, and I drove safely doing it. I’m not talking running cross country popping pills nonsense either. I took my time, if it took and extra hour or two, I fudged. I cannot operate with this clock on my dash. I have figured it out, this clock has cost me at least 30%, more when you figure in the higher fuel consumption. I cannot do this any longer, not under these conditions.
No, it is time, I secured a good paying job in the oil industry, 6 figure starting salary, along with all of the benefits you can throw at a guy. I applied last year, they called the other day, I start the 30th. This is too good to pass up… Oh, no ELD either.