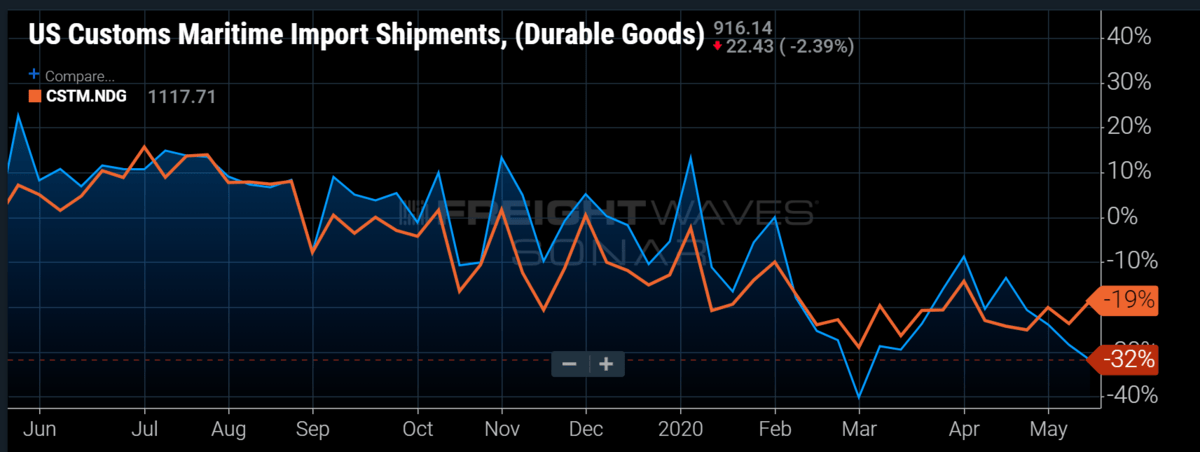
Chart of the Week: Outbound Tender Volume Index– USA SONAR: CSTM.DG, CSTM.NDG
Maritime import volumes fell through most of May after showing strong signs of recovering after the Chinese New Year- (CNY) and COVID-19-inspired trough — the former being an annual event that causes import volumes to drop as much as 30%-40%, but this year was deepened and extended thanks to the pandemic. Most imports can be identified as durable and nondurable goods.
Most freight is classified as durable, but nondurable goods have a higher likelihood of being considered an “essential” good, seeing as most of it lands in the food and beverage category. Nondurable goods imports, even though in decline, have shown more resilience this month as their durable counterparts struggle to find a bottom. What does this mean domestically?
As much as 35% of the freight moved in the U.S. has origins outside of the country. It could be argued that most finished goods have some international influence in its creation. The past two years have exposed glaring weaknesses in the supply chain of many goods. The trade war and pandemic have forced shippers to reexamine where they source their goods due to geopolitical forces as well as the current biological threat.
Many durable goods are relatively easier to source in other parts of the world compared to a lot of the nondurables. Many of the foods and beverages cannot be sourced easily in other parts of the world due to climatological reasons, but there are also trade agreements in place that require the U.S. to purchase as certain amount of these goods.
The main reason nondurable goods are outperforming durable goods is the fact that it is showing where shippers are expecting to see demand in the next few months. The order cycle for finished goods can be as long as two months if demand is unanticipated.
With an abundance of uncertainty around when orders may arrive into the U.S., shippers will extend lead times on their orders as long as they have space, which according to the most recent Business Inventory to Sales ratio, they probably do not.

Businesses are showing the highest amount of inventory to sales number since the Great Recession in 2008-09 at 1.45 months of inventory in March. This is up from 1.38 in February, marking the largest single-month increase since October to November 2008 when it jumped from 1.36 to 1.44, peaking a few months later in January of 2009 at 1.48.
Nondurable goods by definition do not last long in storage and are poorly represented in this figure. The implication is that many shippers have already filled many of their warehouses with durable goods, but nondurable goods have a short shelf-life and will need to keep flowing.
Transportation providers should pay close attention to the flow of durable goods over the next month when gauging the speed of the economic recovery. Hauling nondurable goods may be a good hedge to bridge the gap while demand crawls back to where it was before the shutdown.
A special thanks to all the veterans who have served this week.
About the Chart of the Week
The FreightWaves Chart of the Week is a chart selection from SONAR that provides an interesting data point to describe the state of the freight markets. A chart is chosen from thousands of potential charts on SONAR to help participants visualize the freight market in real time. Each week a Market Expert will post a chart, along with commentary, live on the front page. After that, the Chart of the Week will be archived on FreightWaves.com for future reference.
SONAR aggregates data from hundreds of sources, presenting the data in charts and maps and providing commentary on what freight market experts want to know about the industry in real time.
The FreightWaves data science and product teams are releasing new data sets each week and enhancing the client experience.
To request a SONAR demo, click here.


