Geopolitics helps CMA CGM shipping profit soar 42%

CMA CGM posted impressive Q2 earnings as it navigated volatile supply chain conditions to substantial increases in container volumes and profit.

The closely-held provider of diversified logistics services based in Marseille today said maritime volumes rose 6% to 6.3 million container units from 5.97 million in 2025. Revenue spiked 22% to $9.96 billion from $8.17 billion, while earnings before interest, taxes, depreciation and amortization (EBITDA) were up 42.4%, to $2.26 billion from $1.59 billion. EBITDA margin improved from 19.4% to 22.7%

“Against a backdrop of continued geopolitical instability, the Group delivered solid results in the second quarter of 2026, driven by the performance of our shipping activities, the growth of our terminals and air cargo businesses, and the complementary strengths of our logistics operations,” said Rodolphe Saade, chairman and chief executive, whose family controls CMA CGM. “This performance reflects our strategy of expanding in key markets and investing in strategic assets. They once again demonstrate the strength of our model, our agility and our resilience, all in support of delivering reliable, high-quality service to our customers.”

The company said that the second quarter of 2026 was “a particularly volatile market environment for the shipping and logistics industry, marked by the multiplication of geopolitical conflicts, particularly in the Middle East, and a high level of macroeconomic uncertainty.”

Overall revenue grew 19.2% to $15.69 billion from $13.17 billion as EBITDA improved 31% to $2.99 billion from $2.28 billion and EBITDA margin was up 1.7 points to 19% from 17.3%. Net income was better at $770 million from $520 million.

CMA CGM, controlled by the Saade family of Lebanese descent, has been one of the few global lines to maintain some scheduled ocean services on the Suez Canal-Red Sea route after the Gaza war sparked violence against shipping in late 2023. 

“Global trade remained dynamic, supported by four main factors: resilient global consumer demand, sustained corporate investment generating strong import-export flows, inventory restocking amid heightened uncertainty, and the acceleration of orders ahead of the implementation of new tariffs,” the company said. It added results were bolstered by network adjustments, optimized fleet deployment, and disciplined cost management.

Sustained freight rates help offset additional costs rooted in the Middle East conflict ranging from vessels trapped in the Persian Gulf by the shutdown of the Strait of Hormuz; higher insurance premiums, and lower volumes on services calling the region.

The carrier in the quarter opened several new ocean services, including the Mekong Transpacific Express linking Vietnam to the U.S. West Coast.

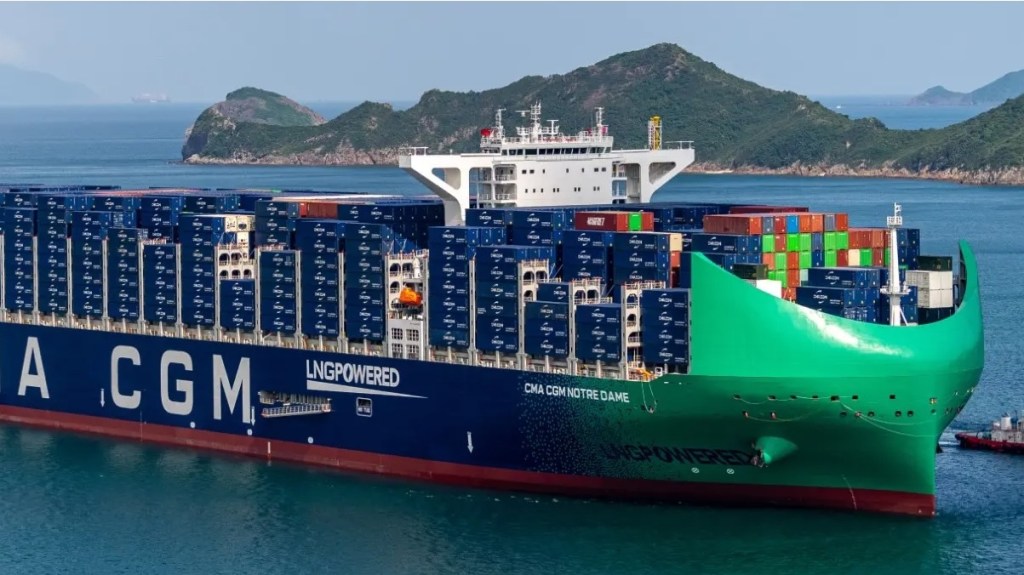
The company also launched the CMA CGM Notre Dame, the world’s largest LNG-powered containership operating under the French flag at 24,212 TEUs. 

Read more articles by Stuart Chirls here.

Read more:

War sends Asia-US ocean rates soaring 234% since February

New test program puts nuclear container ships on the horizon

Shipbuilders could see billions of dollars from defense spending bill

Walkout by union dockworkers shuts down Oakland terminals

Ocean rates weaker after tariff-driven peak season

Benchmark price is up, futures down, diesel on its own

Oil prices are plummeting again, but the benchmark used for most fuel surcharges has risen for a third consecutive week.

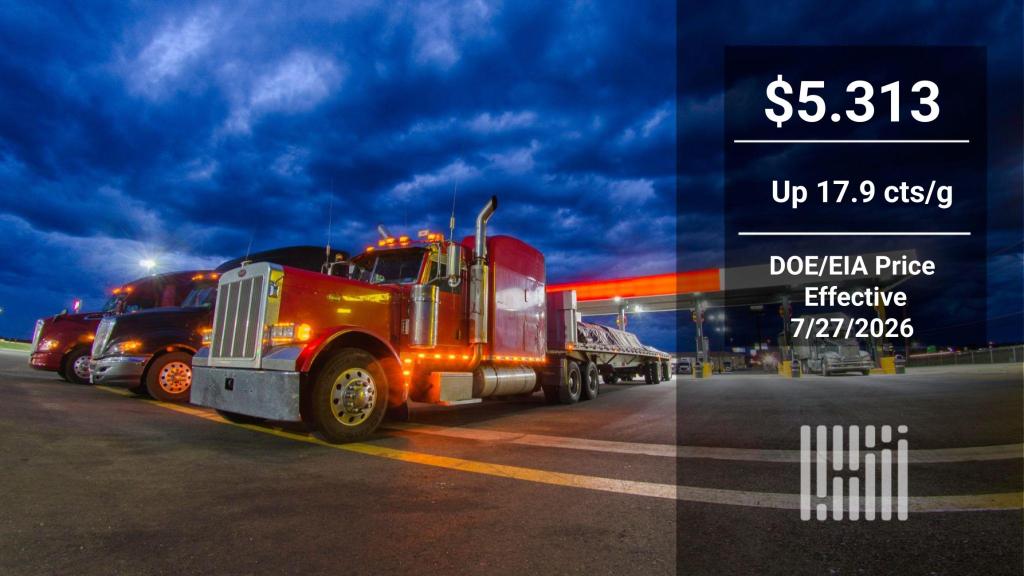
The Department of Energy/Energy Information Administration average weekly retail diesel price climbed 17.9 cents/gallon to $5.313/g, effective Monday but published Tuesday. It’s the third consecutive week of an increase, tacking on 73.5 cts/g during that time.

But as a reflection of how volatile markets have been, the latest DOE/EIA price, even after such a steep slide, has risen to a level that is the highest since just June 8, when it was $5.21/g. It is just under where it was on April 27–$5.351/g–but since that day has experienced double digit increases or decreases eight out of the last 13 weeks.

Given the lag in retail changes, the price would not have been expected this week to reflect the sharp fall in futures prices that began when trading opened for the week Sunday evening U.S. time. That decline followed lower prices Friday that were seen not as a reversal of the market but more of a “breather” after several days of sharp increases.

Possible peace?

The cessation over the weekend of what had been nightly U.S. attacks on Iran, and other rumblings of negotiations, led to higher futures market prices the first two days of this week. 

However, for diesel consumers, the more salient development is that once again, the price of that fuel did not match the fall in the price of crude. 

For example, on Monday the price of world crude benchmark Brent fell $8.42/barrel, settling at $88.36/b. It had settled above $100 just two days earlier. The decline marked a drop of 8.7%.

But also on Monday, the price of ultra low sulfur diesel (ULSD) on the CME commodity exchange declined 6.9 cts/g to settle at $4.1116/g. That was a slide of just 1.65%, far less than the plunge in Brent.

Spread like no other

It led to what appears to be a historic new number: if Brent was converted to cents per gallon and subtracted from the ULSD price, the number would exceed $2/gallon. There is no recent record of that ever occurring.

It is far from a perfect comparison, because front month Brent is for September barrels and front month ULSD is for August, so the crude can not turn into diesel to be delivered next month. But the relationship still shows how disconnected the two markets  have become. 

On the last trading day before the U.S. and Israel launched its attacks on Iran, that spread was about 87 cts/g.

At approximately 11:30 a.m. Tuesday, the spread had widened. Brent was down about 9.7% and ULSD was down about 0.2%.

What it means is that any diesel consumers watching or reading about the price of oil is probably expecting a bigger decline in the price of the fuel at the pump than what will develop with current trends.

That ballooning spread is reacting to a variety of factors, including the general loss of refining capacity in the Middle East from attacks by Iran on facilities in other countries.

But more recently, two other developments are adding further tightness to the diesel market.

  • Drone attacks by Ukraine on Russian refineries, according to Energy Aspects, earlier this month had pushed Russian refinery operations to their lowest processing level in more than 20 years. EA, according to a report by Bloomberg, processed 3.91 million b/d of crude in the first part of July, down 1.4 million b/d from its levels of a year ago. Given the physical properties of Russian crude, that country’s refineries are major producers of diesel. As a result, the country has banned diesel exports.
  • Water levels on the Rhine River, after a scorching hot summer in Europe, are falling to a level that will impact deliveries. There are projections that levels will soon fall to their lowest level since 1990. That will both inhibit fuel shipments as well as make them more expensive to move on restricted barge usage.

More articles by John Kingston

Trump promise on military CDLs sounds similar to existing programs

FMCSA says no to epilepsy exemptions after years of yes

Political divide: red states back non-domiciled CDL changes

3PLs, other tenants signing longer leases for larger warehouses

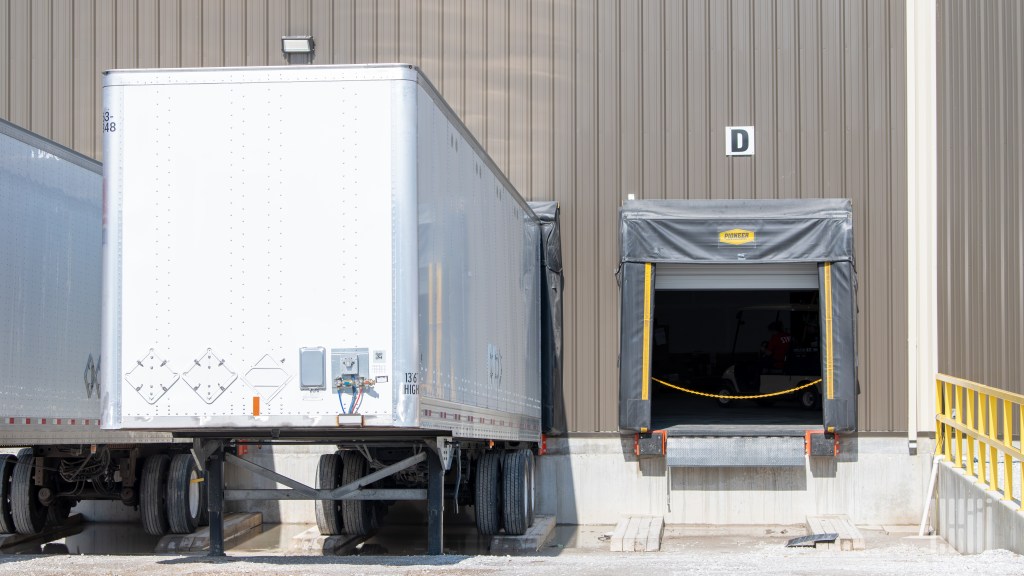
trailers at a warehouse dock

Leases on U.S. industrial properties with at least one million square feet more than doubled to 38 in the first half of 2026 compared to just 16 in the same period last year. Third-party logistics providers continued to hold the majority of the nation’s 100 largest leases, but their share fell, according to a report from CBRE Group.

“The largest leases signal continued stabilization across the industrial and logistics sector,” said Chris Zubel, executive managing director, Americas industrial and logistics at CBRE. “Occupiers are also making longer-term commitments, which reflects increased confidence in their business prospects and logistics planning.”

CBRE (NYSE: CBRE) said the top-100 leases in the U.S. totaled 93.6 million square feet in the first half, a 26% year-over-year increase, “as occupiers showed greater willingness to make long-term commitments to modern distribution facilities.” The average lease term increased by 5 months to 89 months, according to the Dallas-based commercial real estate services and investment firm.

With warehouse rents experiencing significant growth following the pandemic, locking in longer lease terms is a tactical financial decision. It protects companies from future rent inflation and secures capacity in tight, high-demand logistics corridors.

New leases accounted for 66 of the top-100 through the first six months of the year, with renewals accounting for 34. The numbers were 60 and 40, respectively, last year.

California’s Inland Empire led the way, accounting for 14 leases (12.6 million square feet), followed by Dallas-Fort Worth at 11 leases (10.5 million square feet) and Chicago with 9 leases (9.4 million square feet).

“These established hubs are supported by transportation networks and logistics infrastructure, strong labor pools and access to major consumer markets,” the report said. 

Third-party logistics providers held 30 of the top-100 leases versus 38 last year.

Companies in the food and beverage sector were the second-largest occupier, “as they expanded their regional distribution networks to improve supply chain resiliency.” Space held by this group more than tripled to 16.6 million square feet.

General retailers and wholesalers accounted for just 17 of the top-100 leases, a decline from 28 leases in the 2025 period.

Why it matters? By signing long-term contracts for larger spaces, logistics companies appear to becoming increasingly confident in future growth prospects.

More FreightWaves articles by Todd Maiden:

Uber Freight elevates AI ambitions with hiring of logistics technology veteran 

Uber Freight has appointed longtime logistics technology executive Amir Pelleg as its new chief product officer, as the company continues expanding its artificial intelligence-driven transportation management platform.

Pelleg joins Uber Freight after more than 25 years leading product, engineering and operations teams, including executive roles at Amazon, Convoy and Dandy. 

Uber Freight officials said his appointment reflects the company’s investment in technology designed to help customers make faster decisions, reduce supply chain complexity and build more resilient transportation networks.

Pelleg said today’s supply chains are more complex than ever, but advances in AI are creating new opportunities for logistics providers to improve operational confidence, speed and resilience.

“Transportation and logistics have been at the center of my career for more than a decade, and I’ve never been more excited about where this industry is headed,” Pelleg said in a blog post on Tuesday. 

He added that Uber Freight’s combination of transportation management, brokerage capabilities, engineering talent and operational expertise positions the company to help customers manage freight networks more proactively.

San Francisco-based Uber Technologies (NYSE: UBER) operates three platforms: Uber (ride-hailing), Uber Freight (logistics), and Uber Eats (food and goods delivery).  

Pelleg said one principle has consistently guided his approach to building products: begin with customer problems rather than new technology.

“The best products come from understanding how people actually work, where they’re losing time and what’s creating unnecessary complexity,” he said.

According to Pelleg, fragmentation remains one of the biggest obstacles facing modern supply chains. Data often resides in disconnected systems and organizational silos, making it difficult for companies to gain a complete operational picture.

He said AI can play a critical role by connecting fragmented information, generating actionable insights and enabling faster, more confident decision-making.

“The opportunity isn’t simply more technology but in the ability to turn fragmented data into a single, proactive network view,” Pelleg said.

Why it matters: Uber Freight’s decision to hire an experienced logistics technology executive reinforces the industry’s accelerating shift toward AI-enabled transportation management platforms that help shippers improve visibility, automate decisions and strengthen increasingly complex freight networks.

Tale of 2 segments at TFI: LTL steady, Truckload soaring

By most financial measures, the second quarter at TFI International was strong.

Second quarter diluted earnings per share were up 41% to $1.65 from the corresponding quarter a year ago. EBITDA was up more than 11%.

But underneath that, and what came through in Monday evening’s conference call with analysts, is that the rise in profitability came from the Truckload operations at TFI, as well as its Logistics segment, while LTL, which provided 41% of the revenue, improved but not as much as Truckload.  

The difference between the two at TFI (NYSE: TFII) was most stark in their respective EBITDA margins. It was 18% for LTL, and 24.1% for Truckload. (Logistics had a 16.3% EBITDA margin). In the first quarter, the respective numbers were 12.1% and 19.5%. While the percentage gain was more for LTL in the quarter, that measure of profitability continues to lag Truckload.

In one notable part of the conference call, CEO Alain Bedard and CFO David Saperstein talked about the differences in the markets for the two largest segments. 

Supply, not demand

“What we see on the pricing side of Truckload is very impressive,” Bedard said. “It’s mostly because of the supply constraint, not because demand is going through the roof.”

Saperstein said in Truckload’s metric of revenue per truck per week, that measurement accelerated during the quarter. Year-over-year, Saperstein said, that number was up 11.1% in April, 13.3% in May and 14.4% in June. 

Bedard said the Truckload operating ratio (OR) in the first quarter was above 90%, 92.7% to be precise. “And now we’re down to 86.1%. I think that this is quite an accomplishment.”

By contrast, LTL shipments were up 7.5% in the quarter, but revenue per shipment was down 2%.

Bedard, asked by an analyst whether this current rising truckload market was different from past bullish periods, said that was “absolutely right.”

“In a normal trucking environment, guys used to make a lot of money when the demand was high.” he said. “It could last a month, it could last a year, it could last 18 months.”

After that, demand would decline and the bull market would be over. “What I like about this market, which I’ve never seen before in 30 years, is now it’s the supply,” Bedard said. “I think this is more of a permanent thing than we’ve ever seen before.”

More volume in LTL means more costs

In the company’s LTL operations, the rise in second quarter LTL volume–a 7.53% increase in shipments year-on-year–was not an unalloyed good development at TFI, Bedard said.

“We incurred way too many costs in our second quarter operation because of this huge surge in volume,” Bedard said. “But our service suffered also.”

Saperstein added that TFI is implementing changes in its LTL pricing, aided by technology. 

“We now have tools where we’re taking spreadsheets with about 500,000 lines and tons of columns, tons of data,” he said. With technology tools, “we’re able to really isolate the problematic lanes, the problematic freight. And then we’re using that to help our pricing team go in and be real surgical and move faster. We’ve able to treat large amounts of data in a way that we haven’t been able to in the past.”

Daseke’s impact

In Truckload, besides the loss of supply as a benefit, Bedard cited changes in the company’s specialized operations, much of which can be traced back to its acquisition of publicly-traded flatbed operator Daseke in 2024.

TFI’s financial performance was aided by a drop in depreciation of property and equipment, down 5.6% year-on-year. Much of that appears to have come out of the Truckload operations, based on comments made during the call.

Bedard has said previously that Daseke may have been too aggressive in acquiring new equipment, and that contributed to poor performance when it kicked back on to the earning statement in the form of depreciation. But that is now declining. 

“We bought Daseke in ‘24 and we were stuck with its capex,” Bedard said. “These guys liked to buy trucks and trailers. So we had too much capex in ‘24.” He said with various plans in place, that continued into 2025.

But TFI is now “adjusting our asset base to the business we want,” Bedard said. The number of trucks at TFI at the end of the second quarter totaled 11,987 along with 39,710 trailers. A year earlier, the corresponding numbers were 13,511 and 42,796. 

Flatbed operations at TFI have benefited from activities related to wind turbines and data centers,” Bedard said. (He added that a TFI flatbed subsidiary, Lone Star Transportation, is  “good with wind and good with data centers.”)

On the call, Bedard said those improvements in its Truckload segment are expected to continue. For all of 2026, he said TFI expects an improvement of 500 to 600 basis points in the OR at its Truckload segment. He also said the Logistics segment would improve by 250 to 350 basis points, but that LTL would be “comparable.” OR for LTL in the quarter was 11.8%.

“The world of Truckload has changed tremendously over the last six to nine months, with all the things the administration has done in the U.S. to help us reduce supply,” Bedard said.

By contrast, Bedard said, the LTL market in the U.S. and Canada are both “still very soft.”

“There’s no big revolution in demand there, so this is why we’re conservative,” Bedard added. “We want to say that in LTL, we don’t see a lot of major improvement versus what we can see in the Truckload or Logistics sectors.”

“What we’re seeing on LTL is that the reason margins are expected to be flat is because we have too much volume and not enough price,” Saperstein said. “And that’s what we’re working on fixing.”

Bedard did provide some forecasts of future economic performance. He has long touted TFI’s free cash flow numbers, which he said generated about $200 million in the quarter compared to about $186 million a year ago. As a result, Bedard said TFI was able to reduce its debt to EBITDA ratio to 2.4X, compared to 2.5X at the start of the year.

TFI does not have publicly-traded debt. About a year ago, an LTL competitor, XPO (NYSE: XPO), had its rating lowered by S&P Global Ratings to BB, which is less than the investment-grade. At the time, S&P said the debt ratio at XPO was about 2.5X, roughly equivalent to what Bedard spoke about on the conference call when discussing TFI’s debt load. 

Third quarter earnings per share at TFI are expected to be $1.70 to $1.80, Bedard said, compared to $1.65 in the second quarter.

More articles by John Kingston

Trump promise on military CDLs sounds similar to existing programs

FMCSA says no to epilepsy exemptions after years of yes

Political divide: red states back non-domiciled CDL changes

Is This Trucking Market Different? Why Capacity Won’t Flood Back In

Aaron Graft, CEO of Triumph Financial, dives deep into why this freight market cycle is structurally different. He explains that increased litigation, regulation, and legislation act as barriers to entry, preventing the surge of new capacity seen in previous upturns. This fundamental shift suggests the current tight market conditions might persist longer than anticipated, impacting profitability and driver availability.

Triumph CEO and founder Aaron Graf said the current trucking upcycle is more structural than cyclical, pointing to litigation risk, regulatory pressure, and a tight driver market as barriers that will prevent capacity from returning the way it did in 2021. Graf made the comments during a video interview after reporting what he described as a standout quarter, with Triumph’s revenue up 49%.

“In the last cycle it was he who had the cheapest capacity would win. They would put unqualified, undocumented, unverified people into trucks,” Graf said, contrasting that environment with today’s. “Now it’s so different. You’re getting paid $2,000 to move freight, but you might be still staring at a $30 million verdict on the back end of it.”

“It feels more structural. We know it’s a cyclical business. And who’s to say when it would end, but it feels like it has more legs perhaps than what we’ve seen in the past.” — Aaron Graf, CEO and founder, Triumph

Graf pointed to data from Triumph’s factoring business — which he said represents 15% or more of the entire market — to illustrate tightening conditions. The average invoice size in that business rose 26% quarter over quarter, while Triumph’s customer count actually grew 4%. Graf noted fewer loads were tendered to owner-operators in the 1-to-4 truck segment, suggesting that cohort exited the market and drove the supply tightening rather than any meaningful increase in demand.

On brokerage margins, Graf said Q1 saw compression as contracts broke down, but by Q2 the gross dollars brokers earned per load increased because load sizes grew faster than margins fell. Broker margins compressed to between 10% and 12% for brokers Triumph tracks, but the actual dollar revenue per load still rose. Graf used a straightforward example: a 15% margin on a $1,500 load yields $225, while a 10% margin on a $3,000 load yields $300.

Graf said Triumph has eliminated more than $30 million in internal inefficiencies, improvements he credited to the prolonged soft market forcing the company to look inward. On the payments side, he said Triumph now touches 65% of all brokered freight and is running at approximately $54 billion in annualized payments. He also noted the total addressable market for brokered freight has been resized from $110 billion to $135 billion due to inflation. Triumph’s LoadPay product, which Graf described as starting as “the idea of Venmo for trucking,” has expanded into a digital business companion for carriers, offering a virtual wallet with 24/7 instantaneous funding through partners including C.H. Robinson.

Looking ahead, Graf said the market is “more brittle” than many realize, meaning any uptick in demand could push rates higher still given the lack of available, properly verified capacity. He added that even at current revenue levels, small carriers are not generating significant profits once diesel costs and equipment input costs are inflation-adjusted, leaving little incentive for aggressive re-entry into the market.

  • Triumph’s average invoice size in its factoring business — covering 15%+ of the market — rose 26% quarter over quarter, while customer count grew 4%
  • Broker margins compressed to 10–12%, but gross dollars earned per load increased as load sizes outpaced margin compression
  • Graf cited $30 million-plus in eliminated internal inefficiencies and 49% revenue growth as Triumph scales its payments platform to $54 billion annualized

Union Pacific, Norfolk Southern add new customer protections as STB merger review advances

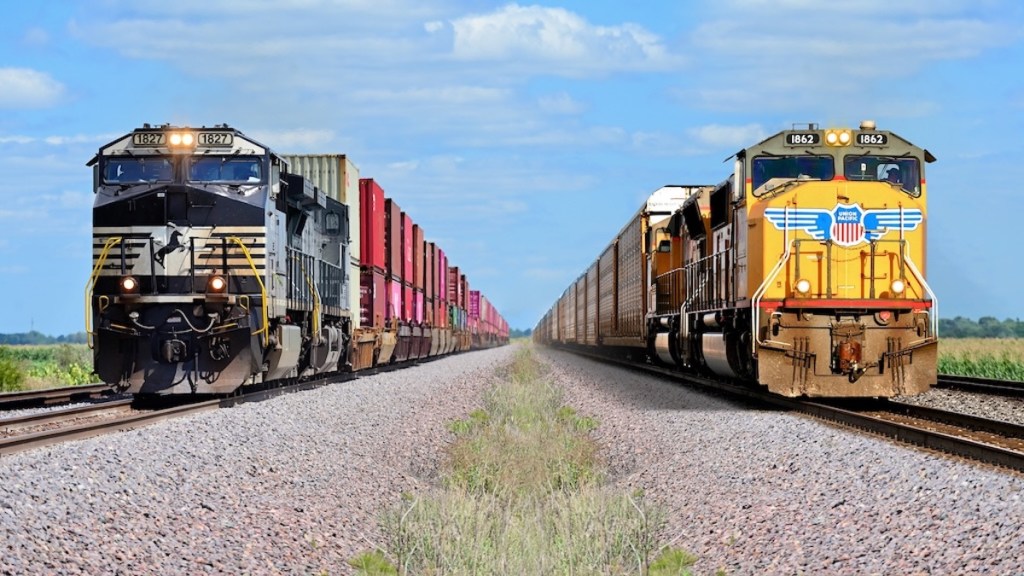
Union Pacific and Norfolk Southern are trying to strengthen their case for creating America’s first transcontinental railroad, adding what they describe as an unprecedented set of customer assurances as the Surface Transportation Board reviews their merger application.

The companies said the supplemental filing late Monday responds to STB requests for additional information and goes beyond protections offered in prior rail mergers.

The move is notable because it shifts part of the merger argument from broad strategic benefits to more concrete shipper protections. That matters in a process where regulators will be weighing not only competitive effects, but also service reliability, access to alternatives, and whether promised benefits are likely to reach customers.

The filing is the second of two tranches, and covers information requested by the STB when it conditionally approved the carriers’ second merger application in late May. 

Four new commitments

The 400-plus page filing adds or expands four commitments:

  • Expanded committed pricing opportunities, including a larger Committed Gateway Pricing program and coverage for bulk unit train shippers.
  • Broader customer protections that preserve Class I rail options for both 3-to-2 and 2-to-1 shippers where legally possible.
  • Temporary access to alternative rail service if integration causes a service decline.
  • A new rate relief process if the merger’s public benefits are not delivered in a timely manner.

Taken together, the commitments are designed to address the two biggest objections typically raised in rail mergers: loss of competition and post-merger service disruption. Union Pacific (NYSE: UNP) said the measures were developed after listening to customers and reviewing the STB’s comments, while  Chief Executive Jim Vena argued the combination would deliver faster, more reliable coast-to-coast service and savings that could flow through to consumers.

Competitive angle

UP and NS (NYSE: NSC) are also trying to frame the deal as pro-competitive rather than consolidation for its own sake. Their public materials emphasize minimal route overlap, more direct routing, fewer handoffs, and expanded access to ports and international gateways, with the merger intended to create a single line from the West Coast to the East Coast.

Another important detail in the broader merger package is the effort to resolve terminal and gateway concerns. The companies said they have completed responses to the STB’s supplemental information requests, and a separate binding agreement with Canadian National (NYSE: CNI) is intended to settle ownership issues involving the Terminal Railroad Association of St. Louis and the Kansas City Terminal Railway.

The additions come as public opposition to the merger mounts. In a July 24 letter to the STB, 24 senators urged the regulator to closely evaluate the acquisition of NS by UP. They warned of the deal’s possible effects on higher consumer costs, and service and safety issues.

What to watch next

The key question now is whether the STB views these voluntary commitments as enough to offset the structural concerns of a two-to-one transcontinental rail merger. The companies still expect closing in mid-2027 if the transaction is approved, but the approval path will depend heavily on whether regulators determine the promised competition safeguards are durable and enforceable.

For shippers, the most relevant part of this filing is not the merger rhetoric, but the practical promise of more routing options, temporary fallback service if things go wrong, and a rate relief mechanism if benefits lag. That suggests the railroads know the regulatory fight will be won or lost on customer impact, not just strategic scale.

Subscribe to FreightWaves’ Rail e-newsletter and get the latest insights on rail freight right in your inbox.

Read more articles by Stuart Chirls here.

Read more:

CN boosts outlook as volume growth tops expectations

BNSF: New UP-CN deal ‘undermines’ case for merger

Union Pacific posts record financial results, raises outlook

Norfolk Southern’s earnings rise with volume gains

New Australia airport has no curfew for cargo campus

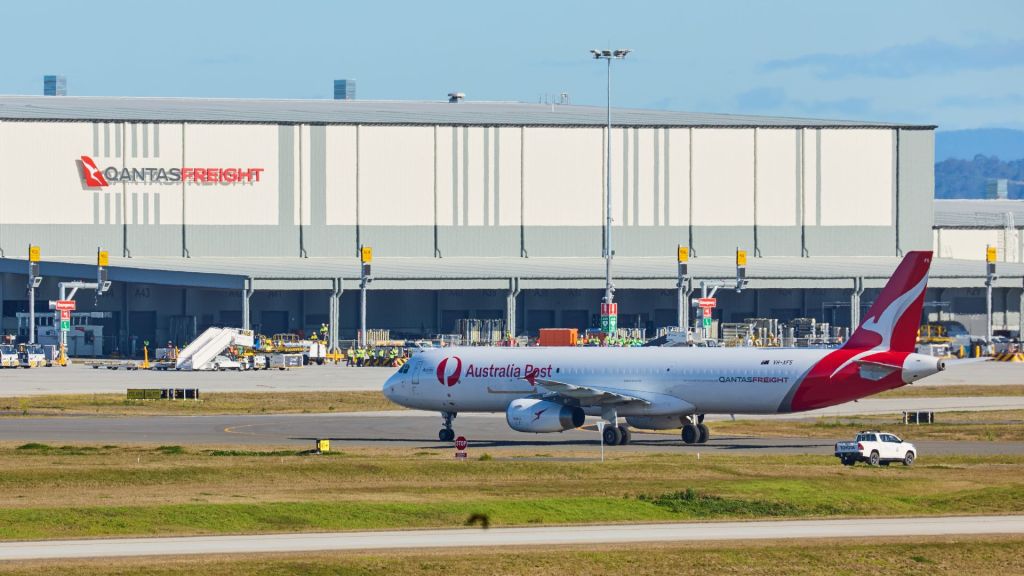
A red-tailed Australia Post cargo plane pulls up to a Qantas Freight airport terminal.

The official opening of a large cargo campus at Australia’s newest airport, outside of Sydney, has businesses excited about opportunities to reach new markets and expands Australia Post’s ability to meet growing demand for next-day delivery of e-commerce packages in New South Wales.

Qantas on Monday operated its first commercial all-cargo flight from Western Sydney International Airport for Australia Post, officially inaugurating its terminal in the cargo zone and kicking off a 10-year extension of its air cargo contract with the national postal operator.

The 30-minute flight from Western Sydney International arrived in Brisbane Monday evening, local time, according to flight tracking databases. Qantas Freight, the air logistics arm of Qantas, said it expects to move more than 160,000 parcels through the 258,000-square foot facility in the first 24 hours, with 12 arrivals overnight. Domestic services will also shuttle between WSI, Melbourne, Cairns, Adelaide, Gold Coast and Perth. Australia Post international flights are expected to begin early next year.

Sydney is now served by two major airports. Sydney Kingsford Smith will continue to handle the vast majority of Sydney’s air traffic. Decades in the making, Western Sydney International brings new capacity and a 24-hour operating model to the region, with no curfew like that at the existing Sydney airport.

It is designed to keep urgent freight — perishables, pharmaceuticals, high-value goods, e-commerce —moving and accommodate future shipping growth. The first phase of the project spans about 7.9 million square feet and can receive up to eight large freighter aircraft and 16 standard-size freighters simultaneously, according to the airport’s website. The facility will initially be able to handle up to 298,000 tons of freight annually, with 2 million more tons of capacity planned in the next development phase. 

WSI will add 33% more air cargo capacity for New South Wales, said Transport and Infrastructure Minister Catherine King, at an opening ceremony, excerpts of which were carried on Australian television networks.

WSI’s passenger terminal is scheduled to open on Oct. 25.

The Freight & Trade Alliance, which represents logistics and cross-border cargo owners in Australia, hailed the new air cargo facility as a boon for importers, exporters and other shippers. 

The new cargo campus “will provide much-needed additional capacity, genuine operating flexibility and greater choice in how time-sensitive goods are moved into, out of and across Australia. Its proximity to Western Sydney’s major logistics and industrial centers, supported by dedicated road connections, should also deliver important efficiencies throughout the supply chain,” said FTA Director Paul Zalai, in a statement. “This is not simply the opening of another freight terminal. It is the beginning of a major new trade gateway that should encourage investment, competition and improved service offerings, while strengthening the resilience of

Australia’s international supply chains for decades to come.”

The commencement of service follows cargo trials with Qantas, Texel Air and ground handling agents this month. 

Australia Post air cargo

Under the revised contract, Qantas Freight will operate a dedicated fleet of two Airbus A330 and six A321 narrowbody converted freighters, plus set aside priority space on the airline’s passenger aircraft to carry shipments on behalf of Australia Post, according to a joint news release. Qantas is scheduled to take delivery of three additional leased A321 freighters, which are being converted from passenger to cargo configuration by Airbus affiliate EFW, in the coming months. The dedicated fleet will support delivery of more than 83 million tons of parcels and freight each year, with volume expected to grow along with future online shopping demand.

[Why It Matters: Australia is gaining more air cargo capacity and reliability for cross-border trade and e-commerce at a facility that isn’t subject to curfews.]

“It’s a historic day for aviation in Australia as our first freight services take off from Western Sydney International Airport. This new terminal will help us meet growing demand for next-day deliveries and move express cargo across Australia and the world,” said Cam Wallace, Qantas CEO of international and freight.

The Qantas and Australia Post partnership dates back more than 100 years, when Qantas flew 106 letters for Australia Post on its inaugural commercial flight.

Dubai-based airport services firm dnata is one of the companies selected to process cargo shipments for airlines. It has invested $22.3 million for storage racks, dollies, forklifts, technology and a semi-motorized materials handling system in the 54,000-square foot facility it leased from the airport. 

In related news, Australia Post announced on Tuesday that it has broken ground on a $324 million parcel super hub near Adelaide, development of which was first disclosed in October.

Australia Post to invest $320M for parcel super hub

Australia Post inaugurates large air parcel hub at Brisbane Airport

Importers sue over forced labor tariffs on 60 economies

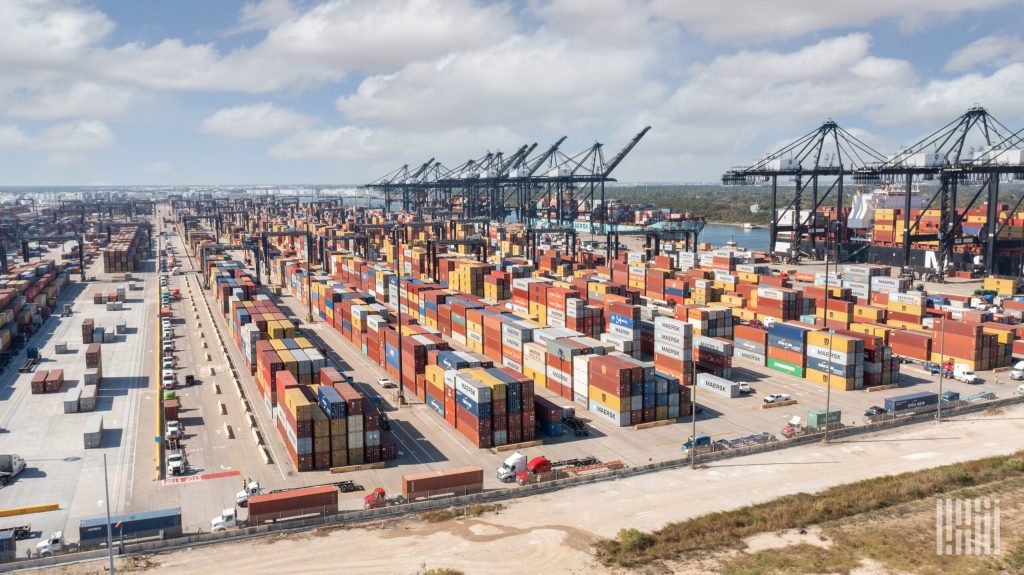
Cargo containers stacked at a busy U.S. port terminal as Section 301 forced labor tariffs of 10% to 12.5% take effect on imports from 60 economies

The tariff wall never came down; instead, it changed statutes.

At 12:01 a.m. Eastern on July 24, the exact minute the temporary Section 122 import surcharge lapsed, duties of 10 percent or 12.5 percent took effect on goods from 60 economies under Section 301 of the Trade Act of 1974. Those economies account for roughly 99.4% of U.S. imports by value. Two lawsuits filed at the U.S. Court of International Trade that day call the forced labor tariffs the third unlawful version of one global tariff regime. This comes after the Supreme Court struck down the International Emergency Economic Powers Act tariffs in February and the Section 122 surcharge in May.

The importers suing are not forced labor apologists. Burlap & Barrel, the New York spice importer leading a proposed class action, buys only from suppliers that meet labor standards and pays smallholder farmers several times what they otherwise receive. Learning Resources, the family-owned toy company that beat the IEEPA tariffs at the Supreme Court, states in its complaint that plaintiffs “in no way, shape, or form condone reliance on forced labor or forced-labor imports. But that is not the real issue here.”

In a twist of irony, a measure sold as an attack on exploitation in global supply chains appears to have landed first on the importers who built their businesses around avoiding it.

What Changed at the Border

Seventeen economies drew the 10 percent rate, including Canada, Mexico, India, Indonesia, Bangladesh and the United Kingdom. This is because each has a forced labor import prohibition, a commitment to impose one under an Agreement on Reciprocal Trade, or a partial regime. Everyone else pays 12.5 percent.

Five economies got different math. For the European Union and Taiwan, the duty works out to the higher of 10 percent or the most-favored-nation rate, so goods already dutied at 10 percent or above see no additional charge. Japan, South Korea and Switzerland get the same treatment at 12.5 percent.

The duty layers rather than replaces. Covered goods still owe ordinary customs duties, antidumping and countervailing duties, and existing Section 301 duties, so Chinese and Brazilian goods now carry both. Section 232 goods are carved out entirely: steel, aluminum, copper, autos, auto parts and timber. Canadian and Mexican goods entered free of duty under USMCA are exempt, as are CAFTA-DR textiles.

That makes classification, not origin alone, the variable that decides exposure. The notice runs 431 pages, and most of it is exclusion lists.

Foreign-trade zone users lost a lever. Covered goods admitted to a zone may enter only under privileged foreign status, which fixes the duty as of admission rather than at entry for consumption. Goods parked in a zone will not escape the tariff if the rate later falls.

One four-day grace period applied: goods already in transit before July 24 escaped the duty if entered by July 28. Two pieces remain outstanding. USTR will set textile quotas for Bangladesh, Cambodia, Indonesia and Malaysia in a separate notice.

The Core of the Lawsuits

Section 301(b) lets USTR act only after finding that a specific practice of a specific country is unreasonable or discriminatory and burdens U.S. commerce, and any response must aim at eliminating that practice. Both complaints argue USTR skipped the country-by-country work the statute demands.

The timeline is their best evidence. USTR opened 60 investigations on March 12, proposed action on June 5, and issued final determinations 133 days after initiation, against the seven-plus months it spent on a single China investigation in 2017 and 2018. One comment period and one three-day hearing covered all 60 economies.

“The third time’s not the charm,” the Learning Resources complaint declares in its opening paragraph.

The Burlap & Barrel complaint alleges the sequence ran backward, that USTR “determined the tariff rates first,” calibrated them “to replicate the invalidated IEEPA rates,” and “assembled economy-specific findings afterward.” Both cite Treasury Secretary Scott Bessent’s assurance that tariff revenue would stay virtually unchanged after the Supreme Court ruling. Both add a fallback: if Section 301 stretches this far, it is an unconstitutional delegation of Congress’s taxing power.

Ed Gresser, vice president at the Progressive Policy Institute and a former assistant USTR for trade policy and economics, told the Section 301 Committee the record cannot carry the weight. He estimated the action “will likely cost American goods buyers about $100 billion annually.” Customs and Border Protection blocked an average of roughly $800 million a year over the last three fiscal years on suspicion of forced labor content.

“We do not see in the Report, in fact, any examples of shipments of goods verifiably made with the use of forced labor passing through customs and into consumer markets or production chains,” Gresser testified.

Why the Duty May Survive Anyway

USTR has a record to point to: two rounds of hearings, more than 2,100 comments, and consultations with more than 45 investigated governments. It also has evidence the threat worked. Between the June proposal and the final action, four economies adopted forced labor import prohibitions and a fifth signed a trade agreement. All five dropped from 12.5 percent to 10 percent.

The notice is also built to break apart without collapsing. Pages 71 and 72 declare each of the 60 tariff actions separate from every other, intended to operate independently, and state that if any exemption is struck down the tariff still applies to the goods that exemption had covered. A win on one economy would not automatically unwind the rest.

Recent history says collection continues meanwhile. The Court of International Trade struck down the Section 122 surcharge on May 7, the Federal Circuit stayed that injunction on June 11, and duties kept flowing through the appeal.

What Importers Do Now

Burlap & Barrel has five shipments arriving at the ports of New York and New Jersey and Baltimore worth about $124,407, carrying an expected tariff near $13,888. The company says it absorbed earlier tariffs and that these duties end that.

Its proposed class covers importers of record that have paid, or will pay, duties on merchandise entered on or after July 24, a group the complaint puts at many thousands nationwide. It asks for refunds with interest and an injunction against collection. No class has been certified, and no court has ruled.

Barry Appleton, a North American trade lawyer of more than 30 years, told USTR during the comment period that the Trade Act pointed to a forum it never used: the dispute settlement machinery inside the agreements the targeted partners already signed.

“A dispute resolved through that forum produces a binding panel decision and a compliance record,” Appleton wrote. “A dispute resolved by tariff produces only a tariff.”

Why it matters: These new Section 301 tariffs lock in 10–12.5 percent duties on nearly all U.S. imports just as earlier global tariff regimes were struck down, forcing importers to pay now while courts decide whether the process was lawful. The fight matters because the duties stack on top of existing tariffs, raise costs across supply chains, and test how far the government can stretch trade statutes to maintain revenue and leverage.

Wove speeds tariff change info for forwarders, TMS – and it’s free

It’s January 2025. The raucous New Year’s celebration has barely subsided when a forwarder’s crystal ball predicts more than 2.5 million rule changes across 40-plus Harmonized Tariff Schedules in the coming 18 months. What’s the next move?

Come in from the ledge. A mostly stealth startup has been making sense of the exploding tariff universe for logistics providers – and for free.

Wove provides workflow automation and document ingestion and structured data for freight forwarders and customs brokers, to automate manual but critical tasks, like creating shipments in CargoWise, creating custom entries, automating emails, quotes, and more.

“But we realized about seven months ago, around the end of last year, that we could repurpose a lot of what we had built to understand the unstructured documents in shipping and logistics and apply that to the U.S. Harmonized Tariff Schedule (HTS),” said Jay Edlin, co-founder and chief executive of Wove, based in Atlanta. He sketched out a user case that solved a problem while opportunistically leveraging a significant change in the market. 

“HTS is published mostly in PDFs,” he said, “so it’s unstructured and hard to really understand. And, this also coincided with [forwarder] FlexPort removing access to their free tariff calculator for a lot of people. This was around the holiday time, and we didn’t have that much going on. So we just decided to kinda build this.”

Within a couple days of launch, Wove, founded in 2022, was hosting the industry’s leading free tariff calculator that Edlin said is now getting thousands of users every week. 

Screenshot of Wove’s tariff simulator.

“Ultimately, that became more of a tariff time machine because as these changes kept coming out, you could really use the tariff calculator and tariff simulator to go back in time and compare what the duties were on entry dates from from last year, and that’s really actually helped us go into the IEEPA (International Emergency Economic Powers Act tariffs) refund calculations,” said Edlin. “So, we’ve been working with companies to help them calculate their tariff refunds.”

The U.S. IEEPA law lets the President regulate or block certain economic transactions during a declared national emergency involving an unusual and extraordinary foreign threat.congress. President Donald Trump used it to deploy tariffs as leverage to negotiate new trade agreements.
The Supreme Court struck down the IEEPA tariffs, ruling the Act does not authorize the President to impose levies. That left Customs and Border Protection on the hook for tens of billions of dollars in refunds, and traders facing massively complex paperwork.

At the same time, the administration shifted to new tariff regimens, some implemented overnight, seemingly based on little more than Trump’s whims. “Obviously,” said Edlin, “the pace of change is not slowing down.” 

Those major changes this past week included Section 338 Canada tariffs and Section 301 levies on dozens of trading partners based on alleged forced labor manufacturing issues. But Wove has them covered.

“We’ve automated that entire process,” Edlin said. “Every time there’s an update in the Federal Register, we get a notification in [messaging app] Slack, and we have [AI] agents that then just go in and basically make all these changes [to a client’s system] automatically.”

An agent is a software system that can reason about a goal and take actions to complete it, and differs from a copilot or workflow automation tool.

Edlin said Wove’s agents, for example, turned around the Section 301 changes, which amounted to something approaching 400 pages, in an hour.

Wove has been using the tariff tool for lead generation and more recently, fielding requests from importers who want to plug it into their own systems via an API (Application Programming Interface). “Or, they wanted a product catalog concept where they could load their own SKUs (a stock keeping unit, an internal inventory code to identify and track a specific product) with HTS codes and SKU numbers, part numbers, and things like that,” Edlin said.

Academic researchers have been using Wove’s tariff data, while some importers and manufacturers are plugging the data into their ERP (Enterprise Resource Planning) systems.

Wove also supports imports into Mexico, Canada, Australia, the United Kingdom, and the European Union. It counts forwarders Hellmann Worldwide, Navia Freight, Future Forwarding, and CBX Global and importers Babcock Power, Greatneck Tools, Roto, and Wabtec (NYSE: WAB) among its customers. 

“Because we’re not a customs broker ourselves, we have no reason to to gate anyone from accessing our data,” said Edlin, “which is a little different from others that may offer similar tools. But, they have different incentives than we do.”

This article was updated July 28 to correct that Wove does not provide import support for Africa.

Read more articles by Stuart Chirls here.

Read more:

New U.S. tariffs target imports from China, Mexico, Canada and 57 other economies
Trump’s tariff on drugs targets one of the world’s most globalized supply chains 
AI shifts from planning to execution as manufacturers confront tariff uncertainty