


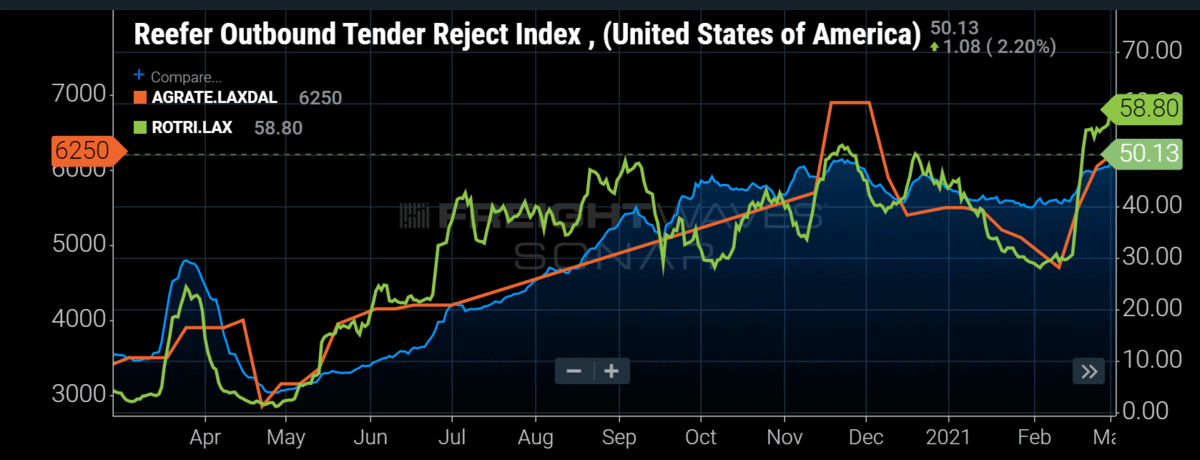
Chart of the Week: Reefer Outbound Tender Reject Index – USA, USDA Produce Truckload Spot Rate – Los Angeles to Dallas, Reefer Outbound Tender Reject Index – Los Angeles SONAR: ROTRI.USA, AGRATE.LAXDAL, ROTRI.LAX
It is widely known at this point that the winter plunge that hit the central U.S. a couple of weeks ago sent shockwaves through trucking networks that are still being felt throughout the country. As dry van capacity has somewhat started to recover, reefer capacity has become even more scarce as national reefer rejection rates once again hit an all-time high, topping 50% this past week. Somewhat surprisingly, this capacity crunch is located largely in areas that the storm did not directly affect, such as Southern California.
Though prone to wild swings in price just about any time of the year, the cost of temperature-controlled or reefer capacity does not typically see this level of increase in tightness and spot rates until early April into June. Historically, that is when several produce harvests begin in earnest out of the state.
At this time of the year, most of the produce that is sourced from California like lettuce, peppers and tomatoes originates from other parts of the world. Most of the lettuce production — one of the state’s largest crops by revenue — has moved to Arizona, where conditions are better during the winter months. Crop-rotation regulations also make it necessary to relocate some of this production. Mexico carries the bulk of the load for many of the other crops.
This recent tightness seems to be derived from a supply side contraction more than a seasonal increase in demand from resulting harvests. The Reefer Tender Reject Index for the Los Angeles market shows a dramatic increase from Feb. 15 to 19, surging over 20 percentage points from 30% to 51%.
This sudden increase coincides precisely with the initial impact of the arctic plunge that pushed subfreezing temperatures all the way to the Gulf of Mexico. This series of unfortunate weather events left the state of Texas crippled for days as the power grid went offline in many areas.

The power outages meant many goods were left without a way to manage their environment, putting many perishables and other goods at risk for spoilage or damage. Demand for reefer trailers exploded in Texas, with the Reefer Outbound Tender Volume Index for the state increasing over 50% in a 10-day stretch, potentially leaving a vacuum in other parts of the country.

California is not the only state affected by the reefer capacity grab. The USDA reported severe shortages for produce capacity in Florida, North Carolina and the Pacific Northwest over the past week.

Spot rates for produce from Los Angeles to Dallas were at $4,700 all-in the week of February 10. That same lane averaged over $6,200 per load last week, more than 60% higher than each of the previous three years’ values.
Some of the difference can be accounted for in the change in general market conditions from the previous years, but traditionally rates do not start to increase in this lane until late March and certainly not on this scale.
With capacity already running at a premium, this year could be one for the record books once domestic produce starts moving in earnest. The freight market was collapsing as it hit last year, but made a fierce return in late fall when capacity was at its most limited for all modes.
There is a little time to recover before the spring rush, but weather has proven to be a fickle player when it comes to produce and transportation.
About the Chart of the Week
The FreightWaves Chart of the Week is a chart selection from SONAR that provides an interesting data point to describe the state of the freight markets. A chart is chosen from thousands of potential charts on SONAR to help participants visualize the freight market in real time. Each week a market expert will post a chart, along with commentary, live on the front page. After that, the Chart of the Week will be archived on FreightWaves.com for future reference.
SONAR aggregates data from hundreds of sources, presenting the data in charts and maps and providing commentary on what freight market experts want to know about the industry in real time.
The FreightWaves data science and product teams are releasing new datasets each week and enhancing the client experience.To request a SONAR demo, click here.