


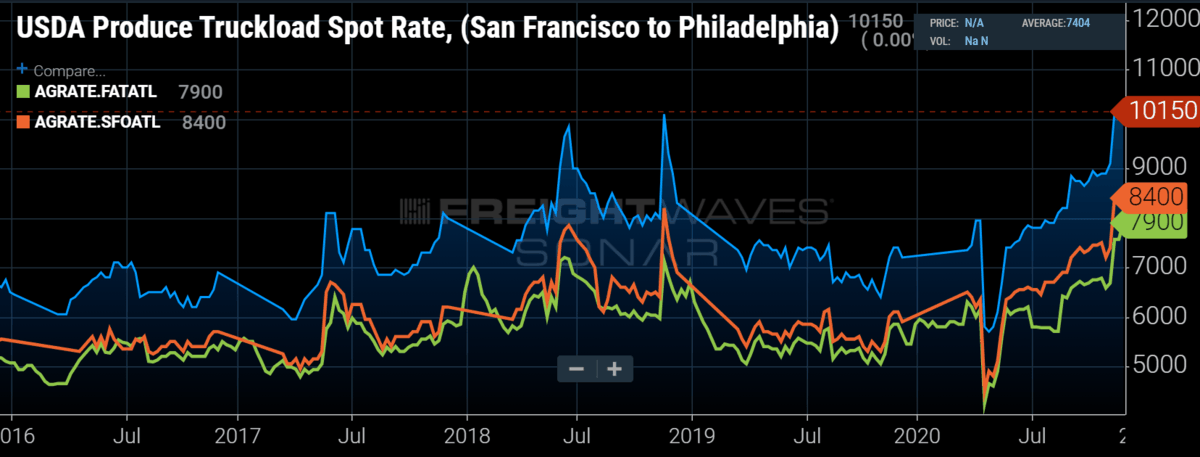
Chart of the Week: USDA Produce Truckload Spot Rate – San Francisco to Philadelphia, Fresno to Atlanta, San Francisco to Atlanta SONAR: AGRATE.SFOPHL, AGRATE.FATATL, AGRATE.SFOATL
According to the USDA, spot rates for truckloads hauling produce are hitting their highest marks of the year, with rates exceeding $10,000 in certain lanes across the U.S. Almost anyone who has been involved in domestic transportation over the past few years knows about the infamous “produce” season that typically hits in late spring when several crops are harvested in California at the same time. While a late-year peak of produce truckload rates is not necessarily abnormal, the difference between the two peak season values is historic.
Produce, which includes fresh fruits and vegetables, is typically transported on temperature-controlled equipment called reefer — slang for refrigerated — trailers. In an earlier Chart of the Week article, we highlighted how reefer carrier revenue growth has outpaced its dry van counterparts through most of the second half of 2020.
Cold chain distribution shifts following the pandemic along with a much smaller supply of available base capacity has made the reefer carrier a much more valuable commodity this year compared with 2019. This is extremely apparent after viewing the cost of transporting produce off the West Coast this November.
The average rate for moving a produce load from the Salinas Valley in Northern California to Philadelphia has risen from $7,550 in mid-June — the typical average late-spring peak — to $10,150 at the end of November. Not all of this increase came at once either.
Potentially more unusual than the rate differential is the steady trend line between the two values. Typically, the spot rates recede after the spring/summer peak before rising later in the year. The average spot rate for Northern California loads did not have more than one week of decline sequentially from June till the end of November, an indication that general market tightness was driving the rate increase.
There is a cycle to produce harvests that is relatively predictable, with most of the crops planted in the region having 90-120 days from planting to harvest. The final large-scale harvest for this area typically occurs in November each year before giving the soil a few months to rest during the cool season — a state regulation to deter pests and disease that come with continuously planting the same crop in the same location.
As mentioned, general market tightness has contributed to the growth in spot rates. Southern California has been a hotbed for freight activity thanks to the import boom resulting from consumer spending and supply chain shifts. Produce haulers will move dry van freight when there are no harvests. Knowing that anyone with a truck and trailer is in high demand at this point means produce shippers will have to pay more of a premium than typical due to other shippers’ willingness to spend high dollar amounts for their services.
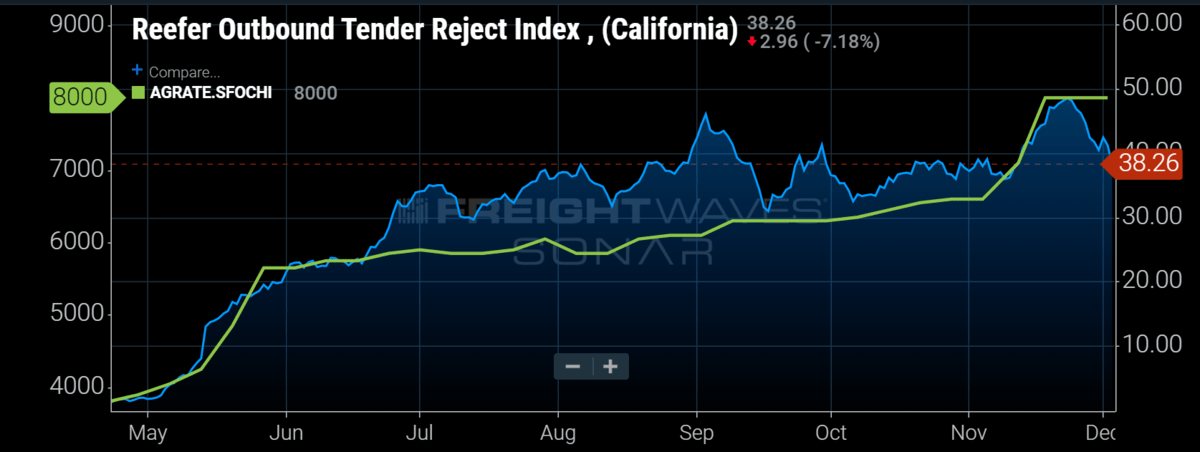
Looking at the Reefer Outbound Tender Reject Index for California in comparison to the produce truckload spot rates, it appears there will be reduced pressure on rates in the near term — the higher the rejection rate, the higher the likelihood for increasing spot rates. The index shows reefer rejection rates falling from near 50% over Thanksgiving to under 40% this week. This is still an extremely high rate of rejection from carriers, but the sharp decline is an indication carriers have more availability this week, which should pull rates back down a bit.
About the Chart of the Week
The FreightWaves Chart of the Week is a chart selection from SONAR that provides an interesting data point to describe the state of the freight markets. A chart is chosen from thousands of potential charts on SONAR to help participants visualize the freight market in real time. Each week a Market Expert will post a chart, along with commentary, live on the front page. After that, the Chart of the Week will be archived on FreightWaves.com for future reference.
SONAR aggregates data from hundreds of sources, presenting the data in charts and maps and providing commentary on what freight market experts want to know about the industry in real time.
The FreightWaves data science and product teams are releasing new data sets each week and enhancing the client experience.
To request a SONAR demo, click here.