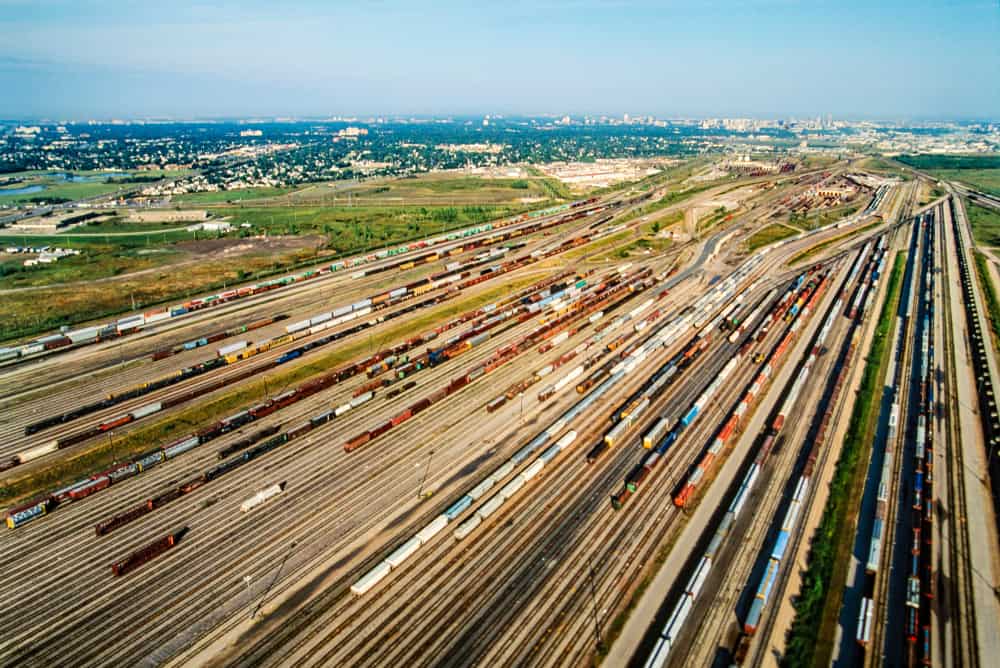
Railroads raked in profits while service deteriorated
Regulatory pressure may have resulted in higher capex for 2018
There’s a curious contradiction in the financial and performance data provided by railroads and the analysts who study them. One statistic, average absolute network velocity, paints a portrait of an industry deep in crisis: average train speed has fallen to less than 22.5 mph. The average train is the slowest it’s been in a decade. The railroads are struggling to fulfill their service obligations, causing customers’ plants to shut down, massive spikes in the costs of critical commodities, and arbitrarily parking their trains in residential areas, blocking neighborhoods for days at a time.

In March, FreightWaves reported on the Surface Transportation Board’s letter to the Class 1 railroads requesting information about locomotive availability, employee resources, service performance, expectations for demand, communications initiatives with shippers, and capacity constrains.
On the other hand, there’s a financial metric that contradicts the thesis of a dysfunctional industry letting its service, infrastructure, and safety practices deteriorate year after year: the operating ratio. The operating ratio is defined as a company’s operating expenses as a percentage of revenue—it’s essentially what percentage of your overall revenues it takes to keep your business running as-is, and the lower the number, the better. Large trucking carriers typically see operating ratios in the mid to low 90s or high 80s: when Knight Transportation, one of the best-run carriers in the business, posted an 81.6% OR for its trucking division in the first quarter of 2018, it was extraordinary. That impressive figure may be related to the interplay between the carrier’s trucking and brokerage arms (its logistics business was operating at 94.6%, suggesting that Knight might have offloaded its unprofitable freight into its brokerage), but that’s an entirely different story.
You’d think that railroads would have similar operating ratios—like truckload carriers, railroads are exposed to the same sorts of fuel price risks, they operate a large number of expensive machines that they use as much as possible, and unlike trucking, the railroads have a largely unionized workforce. But you’d be wrong. Here are the Q1 2018 operating ratios for the seven Class 1 railroads:
CSX: 63.7%
Union Pacific: 64.6% (Q1 record)
Kansas City Southern: 65.8%
Canadian Pacific: 67.5%
Canadian National: 67.8%
BNSF: 67.9%
Norfolk Southern: 69.3% (Q1 record)
Union Pacific and Norfolk Southern bragged in their earnings reports that their latest operating ratio numbers were first quarter records: they’re making more money than ever before. One of the reasons why railroads are so flush with cash at the moment is that truckload prices are so high: the railroads are raising prices right alongside truckers, just because they can.
“We see the current truckload base rate environment and the expected double-digit increases in re-priced contracts during 2Q18 as a net positive for intermodal volumes and pricing. Recall TL rates set the “ceiling” for which rails may price the line-haul portion of the intermodal move against, therefore higher TL rates translate to improved rail pricing on that IM business that isn’t locked into multi-year contracts,” wrote Bascome Majors, a transportation equities analyst at Susquehanna, in his June 13 Railroads Industry Update.
FreightWaves has been reporting on shippers’ dissatisfaction with the railroads since last November, when contributer Ben Thrower covered ag shippers’ complaints that CSX’s turnaround was causing plant shutdowns. Nearly a month later, things hadn’t really changed.
Finally, after the STB letter, it seemed that railroads were starting to get the message. A number of the Class 1s have begun making large capital investments to make their networks run more efficiently and hopefully improve service. Union Pacific’s Brazos Yard, under construction in Texas about halfway between Dallas and Houston, will be the railroad’s largest capital investment ever, at $550M. In April, BNSF announced it would make capital expenditures of $230M in California this year, including new production track in the Los Angeles intermodal yard and new lift equipment. Norfolk Southern said it will plough $930M into track, bridges, and communication systems and $170M into its facilities and terminals this year; overall, Norfolk Southern will spend about 6% more on capital investments than it did last year.
Canadian National said it will spend CA$210M in Quebec this year, planning to install about 40 miles of track, 155,000 crossties, and rebuild in excess of 35 grade-crossing surfaces. “We are again investing across the province to support a safe and fluid railway network and our increasing investments in technology are making our Montreal headquarters part of the growing tech economy of Quebec,” said Michael Farkouh, CN’s Eastern Region VP, in a statement on Thursday.
The bottom line is that the financial efficiency metrics that investors love, like operating ratios, often come at the expense of the performance metrics that the railroads’ customers need, customers who would prefer to have more capacity available on a regular schedule for cheaper rates. Unlike trucking, the railroad industry is quite consolidated, and because some cargo like sand, grain, coal, scrap metal, and crude oil is almost never economical to move by truck, the railroads hold nearly permanent pricing power. At an investor presentation in Miami Beach this February attended by FreightWaves, an analyst asked the chief financial officer of Union Pacific, Rob Knight, why he thought the government would permit the railroad to reach a 55% OR, the company’s stated goal. “We’ve been dealing with them for 150 years,” Knight replied.
Stay up-to-date with the latest commentary and insights on FreightTech and the impact to the markets by subscribing.


