Mass diversions of container ships around Africa’s Cape of Good Hope caused spot rates to surge, but the Red Sea effect has a limit, which may have already been reached.
Upward momentum has slackened. Rates in most lanes have leveled off. Several indexes for European lanes have pulled back.
The Shanghai Containerized Freight Index (SCFI) dropped 2.7% in the week ending Friday versus the prior week, the first weekly drop since late November.
“The squeeze in freight rates into Europe continues to abate from high levels, though freight rates in other regions remain firm,” said Jefferies shipping analyst Omar Nokta on Friday.
The rate dynamic now is very different than in the pandemic boom. The 2020-2022 supply chain crisis was driven by demand, as consumers bought more goods amid the pandemic. The current rate surge is driven by supply.
Liner diversions around the Cape of Good Hope extend voyage time, tying up ship and container equipment supply. But as liners adjust schedules to the longer routes, rates should theoretically stop rising, barring higher demand.
Container lines are taking delivery of a record number of new ships this year, which should give them the added vessel supply to handle longer routes. Furthermore, the Chinese New Year holiday in early February should temporarily limit vessel demand, easing the squeeze.
‘Breathing room’ ahead
Lars Jensen, CEO of consultancy Vespucci Maritime, wrote in an online post: “Once we get past Chinese New Year, not only will demand drop and give some breathing room, [but] we will also begin to see vessels and equipment flows settle into a predictable pattern on their new round-Africa routings.
“This will still mean rates are much higher than pre-crisis levels, because the longer routes will soak up large amounts of capacity and carry extra cost, but I expect the spike in spot rates to abate somewhat. Contract rates, on the other hand, are likely to increase as it appears we might be settling into a round-Africa [pattern] for the foreseeable future.”
The effect on the contract market appears in the China Containerized Freight Index (CCFI), which also includes contract rates, unlike the SCFI. While the SCFI pulled back this week, the CCFI rose 9%.
Platts indexes
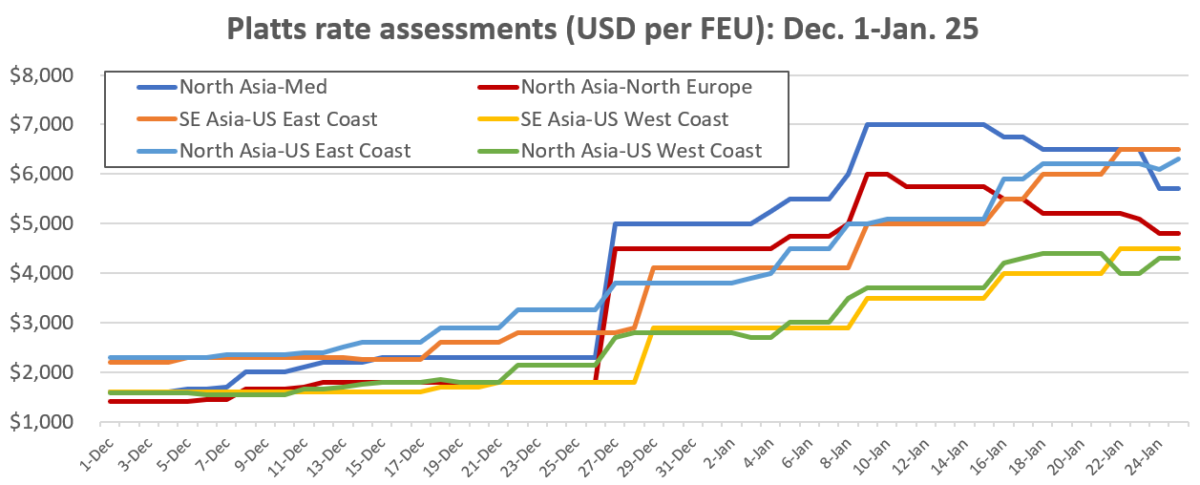
On the spot rate side, assessments from Platts, a division of S&P Global (NYSE: SPGI), imply a peak has been reached.
Platts put Thursday’s North Asia-Mediterranean spot rates at $5,700 per forty-foot equivalent unit, down 19% from the high reached on Jan. 9-15. Its North Asia-North Europe assessment, at $4,800 per FEU, was down 20% from the Jan. 9-10 high.
In contrast, rates still remain at their highest level in U.S. import lanes, although gains have slowed.
Platts put Southeast Asia-U.S. East Coast rates on Thursday at $6,500 per FEU, up 195% from Dec. 1; North Asia-U.S. East Coast rates at $6,300 per FEU, up 174%; Southeast Asia-U.S. West Coast rates at $4,500 per FEU, up 181%; and Southeast Asia-U.S. East Coast rates at $4,300, up 173%.

Drewry WCI indexes
The Drewry World Container Index (WCI) shows rates still rising, albeit at a much slower pace in European markets.
The WCI global index for the week ending Thursday increased 5% versus the prior week. The index for Shanghai to Rotterdam, Netherlands, came in at $4,984 per FEU, up only 1% week on week (w/w). Spot rates for Shanghai to Genoa, Italy, averaged $6,365 per FEU, also up 1% w/w.
In contrast, the WCI Shanghai-Los Angeles index shot up 13% w/w, to $4,344 per FEU, and the Shanghai-New York assessment rose 9% w/w, to $6,143 per FEU.
FBX indexes
The Freightos Baltic Daily Index (FBX) global composite was at $3,409 per FEU on Thursday, flat since Monday.
The FBX China-Mediterranean rate was $6,403 per FEU, 8% below the high hit on Jan. 18. The China-North Europe rate was $5,366 per FEU, down 7% versus Jan. 18.
The FBX China-East Coast rate was still at its highest level of the Red Sea crisis period, at $6,142 per FEU, flat since Monday but up 143% since Dec. 1.
The FBX China-West Coast rate is still rising and is also at its highest level, at $4,198 per FEU on Thursday, up 169% since Dec. 1.
Click for more articles by Greg Miller
Related articles:
- Container spot rates rocket even higher as Red Sea crisis drags on
- Red Sea conflict worsens, forcing more ship detours around Africa
- Container lines ‘scramble’ to rent more ships amid Red Sea crisis
- West Coast shipping rates surge as Red Sea fallout goes global
- Container shipping rates spike as Red Sea crisis draws first blood
- How safe is Red Sea? Different shipping lines have different answers
- US-led forces in Red Sea will be defensive ‘highway patrol’
- Red Sea fallout much greater for containers than tankers, bulkers
- Why attacks on container ships caused container stocks to jump


