


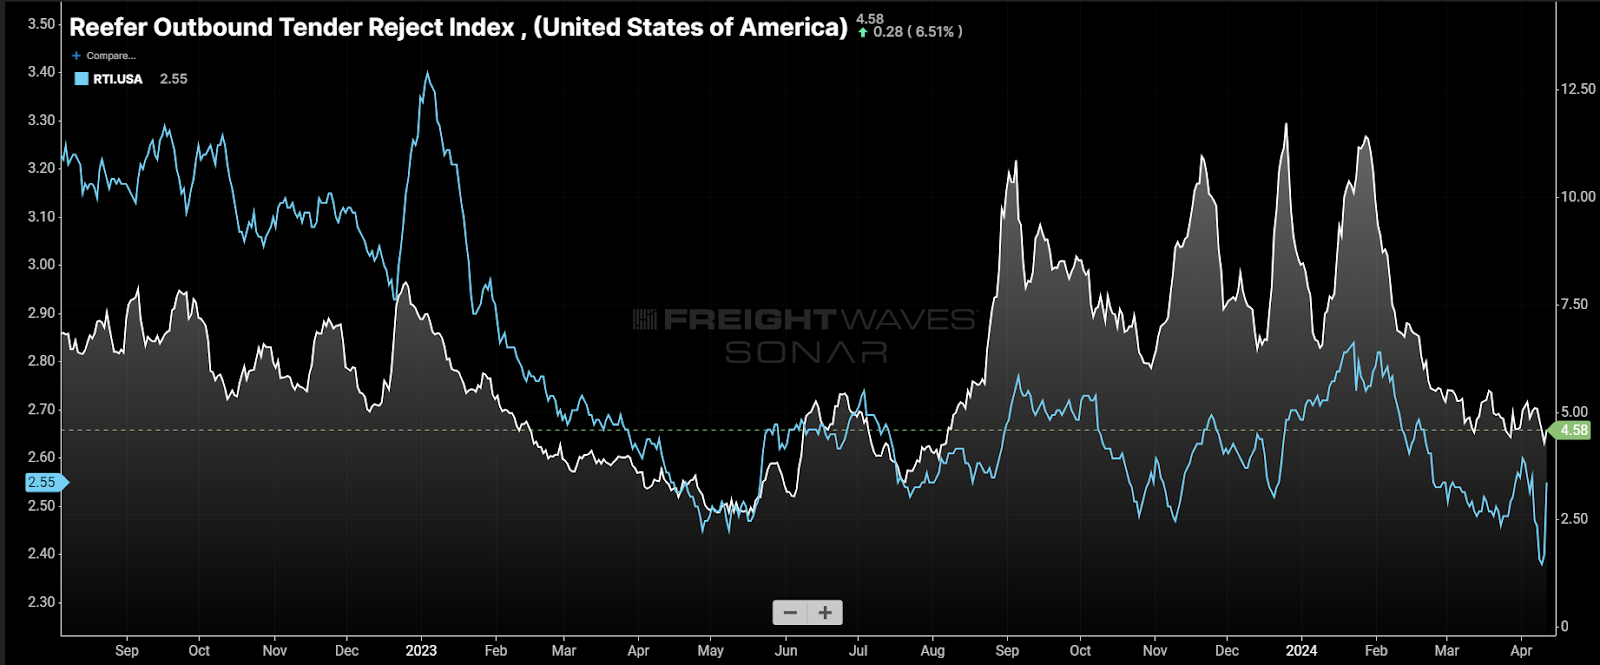
Chart of the Week: Reefer Tender Reject Index, Reefer Truckload Index – USA SONAR: ROTRI.USA, RTI.USA
The refrigerated (reefer) truckload market has settled after showing signs of destabilizing in front of the broader market last fall.
The Reefer Outbound Tender Reject Index (ROTRI) has averaged below 5% since the start of March after spending much of Q4 2023 and January above 8%. The Reefer Truckload Index (RTI) that measures aggregated spot rates for reefer loads has moved similarly, indicating the market has returned to a looser state.
Rejection rates measure the rate at which carriers are turning down load requests from their shipper accounts. The higher the figure, the more challenging it is to find trucking capacity.
The reefer market tends to be much less served than the dry van market, and far more niche. Because of this, rejection and spot rates tend to be more volatile.
The refrigerated freight space is typically influenced heavily by seasonal demand fluctuations. The various produce runs can be extremely disruptive, even for companies that don’t ship produce.
Spiking rates lure carriers away from their more consistent business when seasonal harvests come outside of expectations. This appeared to be a driving reason for spiking rates and rejections in the Pacific Northwest last fall.
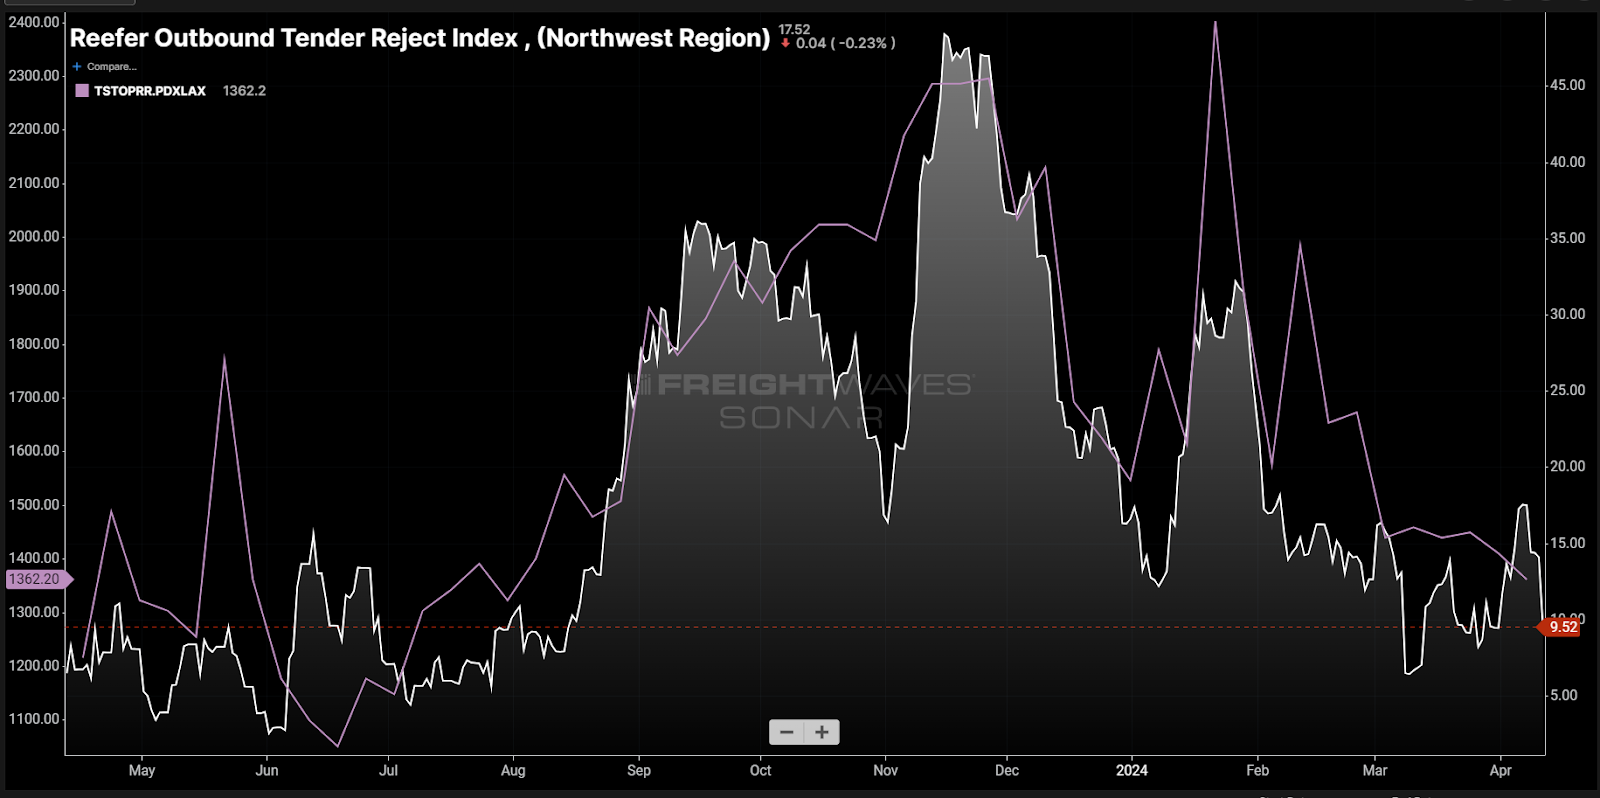
Northwest regional rejection rates spiked above 30% last September after averaging under 8% through most of the spring and summer. Spot rates from Portland, Oregon, to Los Angeles — normally an extremely cheap and easy lane to cover—jumped from $1,330 to $1,950 (46%) in less than a month, according to Truckstop.com.
Several harvests occur in the Northwest from August through October. The apple harvest is probably the best known to those outside trucking, but potatoes, berries, onions and hops are also big moves in this area.
Christmas tree runs hit in November and can also cause rates to spike in what is normally an extremely slow area for freight shipping demand.
January brought the lowest temperatures of the year and hit the Midwest particularly hard.
Shippers saw a sharp increase in their need for protect-from-freeze service — also served by reefer trailers due to the insulation and temperature control unit.
Anyone watching the Taylor Swi … er … Kansas City Chiefs playoff game against the Miami Dolphins in January will recall wind chills below minus 20.
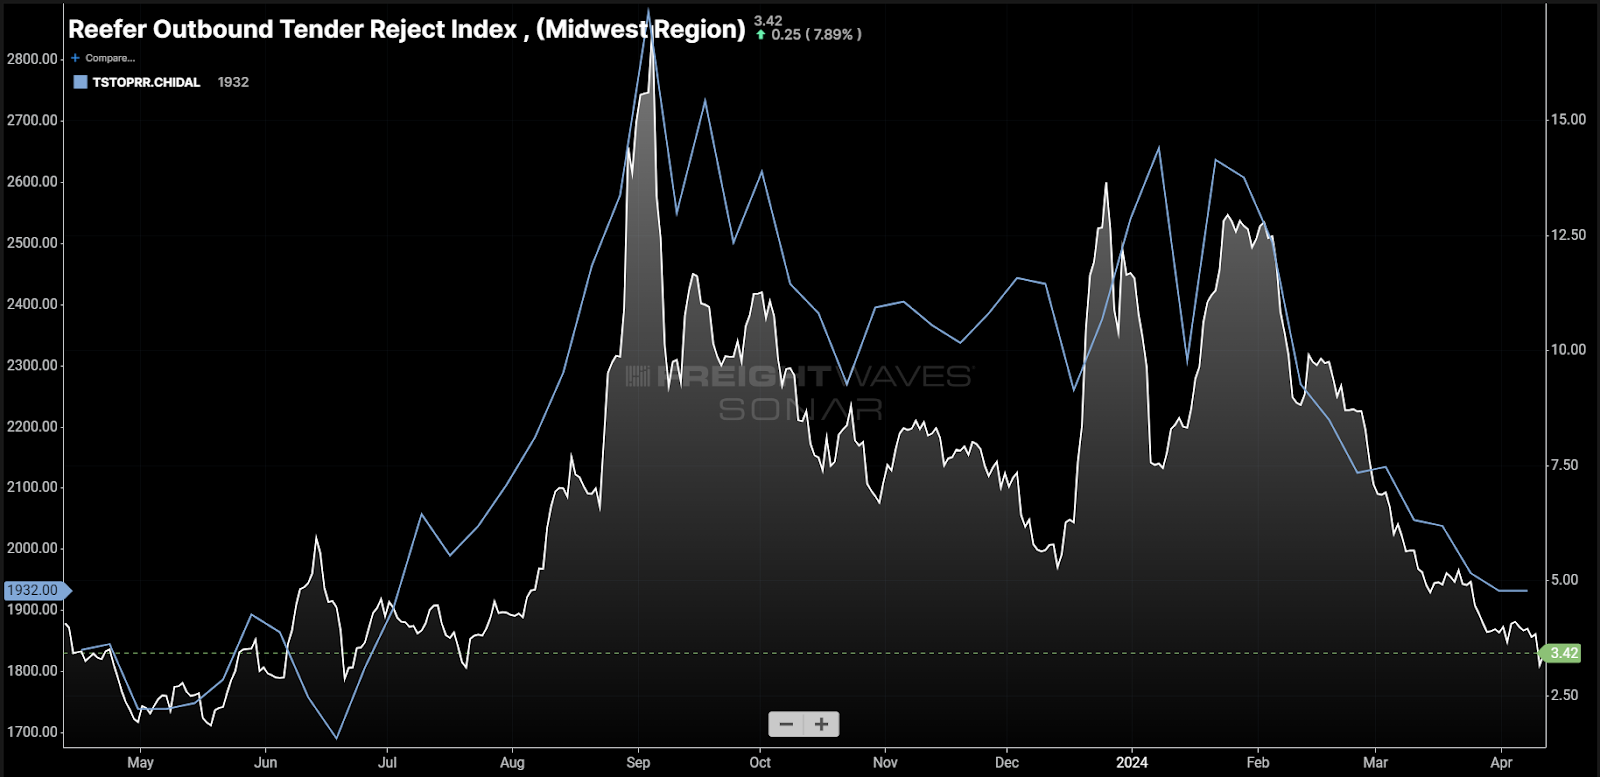
Regional reefer rejection rates out of the Midwest jumped back above 12% in mid-January with spot rates from Chicago to Dallas jumping 15% in a week.
Reefer rejection and spot rates have been on a slide since the extreme cold event. There were signs of life at the end of March but nothing sustainable or nearly as strong as the previous two disruptions.
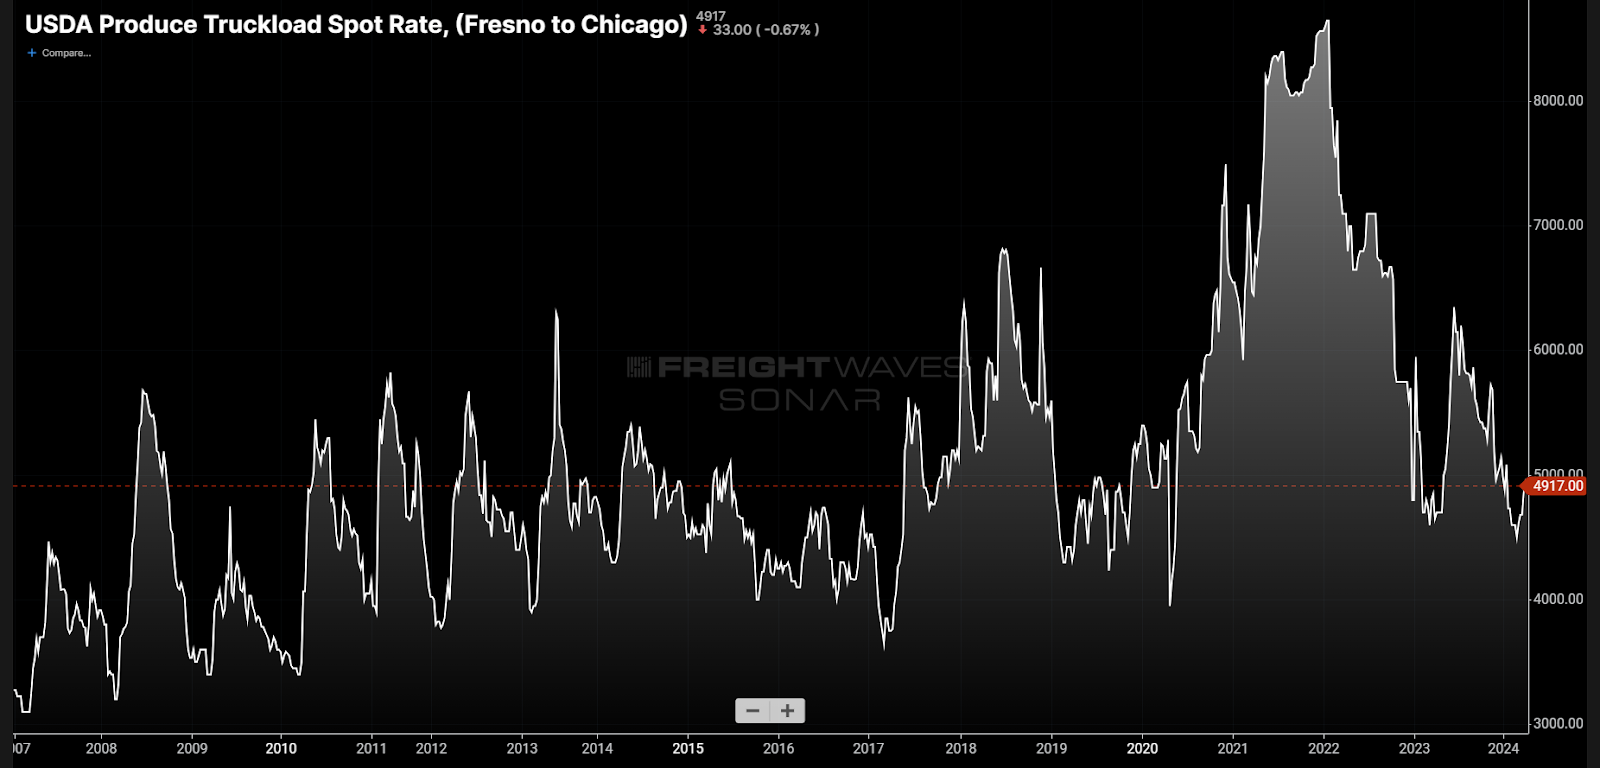
Produce runs are scheduled to start soon off the West Coast, typically hitting somewhere between now and June. Looking at produce-specific runs from California’s Central Valley to Chicago, spot rates tend to start jumping about now and remain elevated into July. A wet winter may delay harvests, which tends to make the market more responsive when they are off schedule.
Produce alone will not lead to a market flip, however. That is largely determined by the larger capacity environment, which remains abundant. As long as there are more trucks than freight, the disruption will be temporary, but that doesn’t mean that it will remain a quiet year for reefer carriers.
The California produce season was a leading indicator of a broader market turn in 2017. It was not the thing that turned it, but it did signal it was likely to arrive. At the bare minimum, the refrigerated sector does appear to be telling us a shift is on its way even though the spring has been soft.
About the Chart of the Week
The FreightWaves Chart of the Week is a chart selection from SONAR that provides an interesting data point to describe the state of the freight markets. A chart is chosen from thousands of potential charts on SONAR to help participants visualize the freight market in real time. Each week a Market Expert will post a chart, along with commentary, live on the front page. After that, the Chart of the Week will be archived on FreightWaves.com for future reference.
SONAR aggregates data from hundreds of sources, presenting the data in charts and maps and providing commentary on what freight market experts want to know about the industry in real time.
The FreightWaves data science and product teams are releasing new datasets each week and enhancing the client experience.
To request a SONAR demo, click here.
H man
Now even the biggest companies are telling their customers they can no longer honor their contracted rates
My arms hurt
I do store deliveries, front side door opens the stairs slide out of the slot for the freezer, and 6 6 foot tall pallets are separated by numbers for which store they go to. Back half of trailer is refrigerated for milk and eggs and whatever, vaccinated driver’s can’t do store deliveries they’ll fall over dead .
Steven R Manson
The rejections are cause.of the abysmal rates they want. For some it’s almost non profitable. The only ones who can afford those low rates have severe safety issues on their trucks. Go to troutdale in the bontail area and check out those trucks…missing rubber, missing exhaust…seems DOT isn’t doing their job
Stephen Webster
In Canada reefer loads comeing to ont from the U S are under $2 cd per mile or about $1.25 U S per mile plus in Canada reefer loads are about 90 cents cd per mile or 65 cents U S per mile plus fuel and carbon tax a number of trucking companies are paying driver services to Corp account about 50 cent cd per mile or 36 cents U S per mile with is the same as 28 cents U S per mile to a payroll truck driver for those that come as foreign students ( drivers) This is so many good people that were lease ops or owner ops and trucki finance companies are in need of gov help or they will close or go bankrupt and gov owned building that is 24 story high has many truck drivers living there through a hard to house disabled ( truck drivers) male personnel program at a cost of almost $2000 a month per person in gov per month plus help from many non profits.