Tanker shipping has already seen a big trade shift in the wake of Russia’s invasion of Ukraine. But it’s nothing compared to what will happen when the EU bans tanker cargoes from Russia.
New data from commodity analytics firm Kpler confirms that Russian seaborne petroleum exports remain historically high and the EU remains a major buyer.
The EU has made some progress in weaning itself from Russia. But it has a long way to go and time is short. The EU ban on seaborne crude imports begins on Dec. 5, the ban on refined products imports on Feb. 5.
Given how high volumes remain today, these deadlines could lead to abrupt, wrenching and significant changes to global commodity flows.
Russian crude exports on the rise
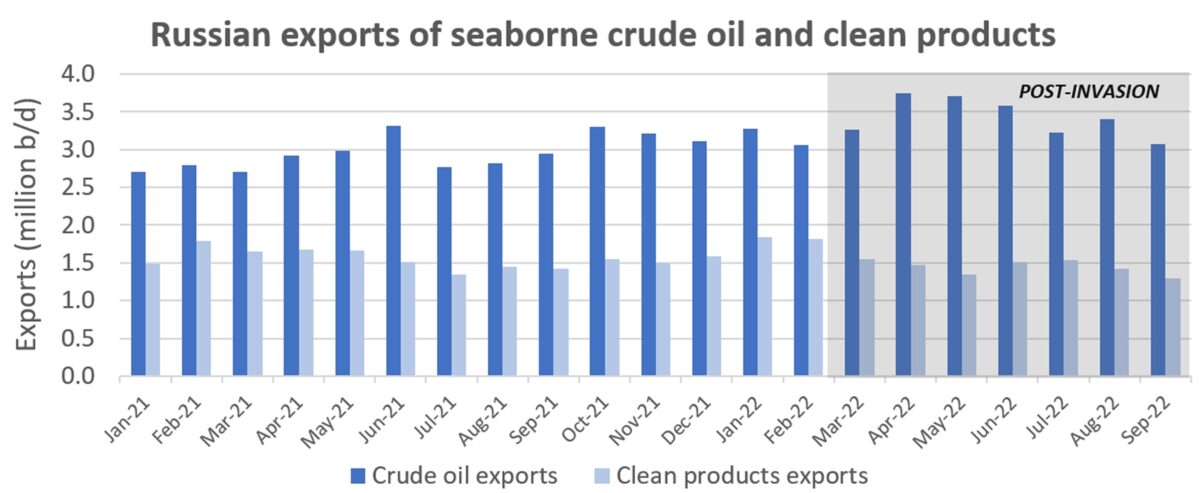
Kpler’s data shows that Russia’s seaborne crude exports averaged 3.4 million barrels per day (b/d) during the seven months since the war began. That’s up 17% versus the same period in 2021.

Russia’s clean products exports averaged 1.4 million b/d in March-September, down 5.5% year on year (y/y).
Altogether, Russia’s crude and products seaborne exports averaged 4.8 million b/d in March-September, up 9% y/y. So, despite all the “self-sanctioning” rhetoric about not supporting the military aggressor, more Russian cargo is being loaded aboard tankers than before the invasion.
EU progress on replacing Russian crude
The EU is less reliant on Russian crude than Russian refined products (particularly diesel). Even so, Russia’s share of EU seaborne crude imports remains substantial, even after recent trade shifts.
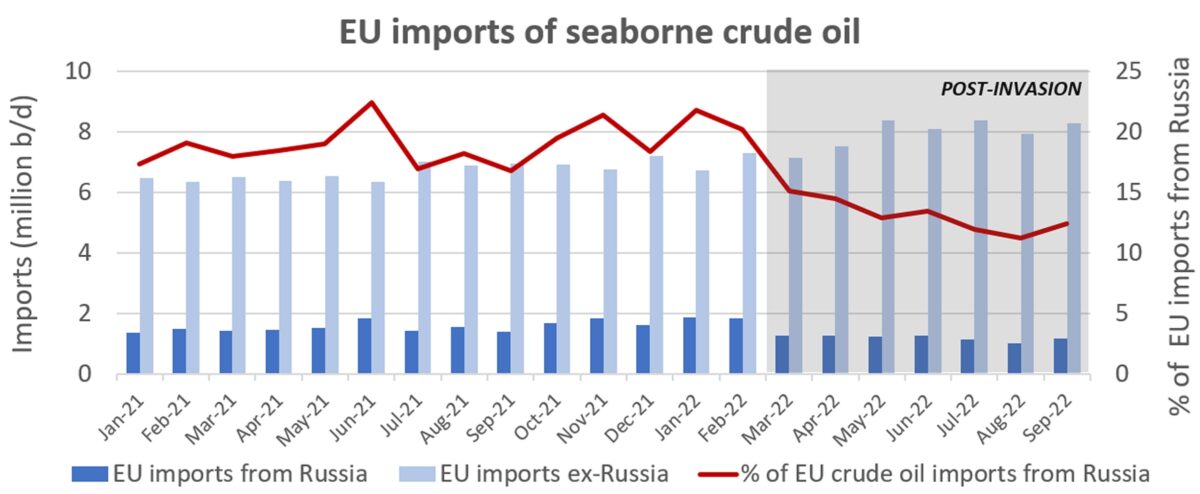
Kpler data shows that EU countries imported an average of 1.2 million b/d of seaborne crude during the seven months since the war began. That’s down an average of 320,100 b/d or 21% compared to the same period in 2021.

“EU members have materially cut imports from Russia, substituting barrels from the U.S. and elsewhere,” Reid I’Anson, senior commodity analyst at Kpler, told American Shipper.
The average volume of EU crude imports from countries other than Russia was 1.3 million b/d higher in March-September versus the same months the year before. This has been a big plus for tanker rates, as replacement cargoes are traveling longer distances.
Tanker demand is measured in ton-miles: volume multiplied by distance. By replacing (and heavily supplementing) short-haul Russian crude with longer-haul replacement crude, the EU has boosted tanker demand.
The shift away from Russia in the past seven months is dwarfed by what needs to occur starting Dec. 5, when the EU import ban hits.
To put the scale of the coming shift in perspective, the EU’s average crude imports from Russia in September are down 668,926 b/d from February, when the invasion occurred. That decline took seven months. Less than 10 weeks from now, the ban goes into force. At that point, EU crude imports from Russia need to fall by almost twice as much as they did in the seven months since the invasion.
The EU needs to bring the current market share of Russian seaborne crude — at 12% this month, according to Kpler data — down to zero.
EU still highly dependent on Russian distillates
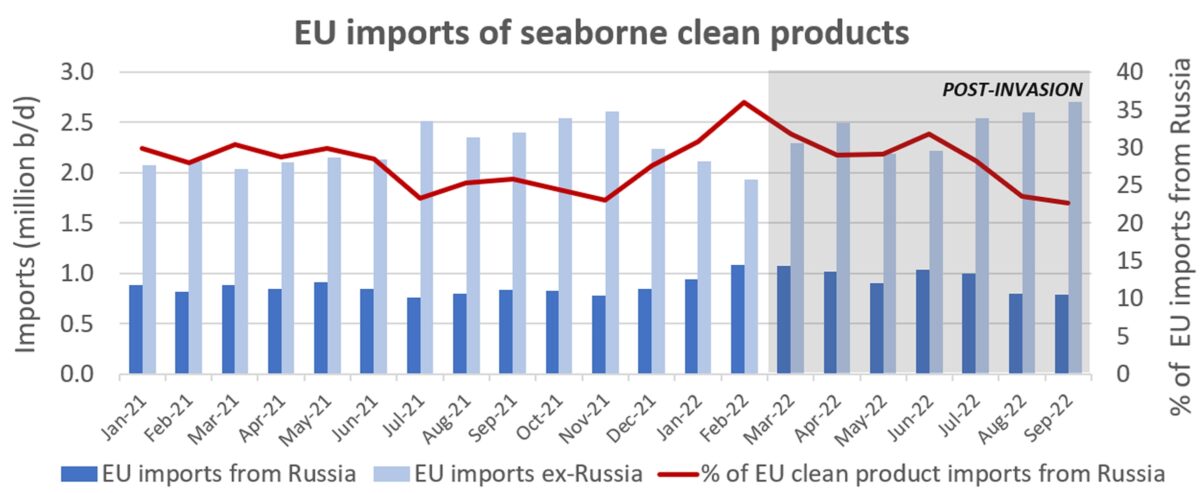
While Russian exports of products to all destinations have moderately decreased since the war began, the EU has actually increased its products imports from Russia during this period.
“On the clean product side, EU members continue to import a lot of Russian diesel/gasoil [with] basically no cut in volume since the war began,” said I’Anson.
He explained that the EU’s replacement of Russian crude with U.S. crude has had the side effect of increasing EU demand for Russian diesel. It “reinforces the EU need for distillates given that U.S. crude imports are notably more light and sweet compared to Russian grades, and light grades yield more gasoline and light ends [versus distillates].”
Kpler data shows that EU imports of Russian clean products averaged 945,501 b/d in March-September. This is up 12% or 102,716 b/d compared to the same period in 2021.
And there’s yet another plus for product-tanker rates: The EU not only hiked its imports from Russia, it also increased imports from other sources further afield, adding to tanker ton-mile demand. Average EU imports of seaborne clean products from non-Russian sources were up an average of 193,381 b/d in March-September 2022 versus March-September 2021.

Looking forward, the EU import ban on Russian products appears much more problematic than the looming ban on Russian crude.
Over the past seven months, Russian seaborne products imports accounted for an average of 28% of total EU products imports — double Russia’s share of the EU’s seaborne crude imports during the same period.
Click for more articles by Greg Miller
Related articles:
- Russia oil sanctions: How conflict with EU rules threatens G-7 price cap
- G7’s grand plan to squeeze Russia oil windfall hinges on tanker shipping
- Tankers could profit if US restricts gasoline and diesel exports
- War effect on crude trade: Long-lasting and just beginning
- How new EU sanctions on Russia will shake up global energy trade
- Tankers carrying diesel and gasoline rake in cash amid pain at the pump
- Russia tanker business is alive and well. Oil exports ‘remain strong’


Carlos_P
😇Europe still Drinks Putins oil on their knees like good little Euro Libsluts 💦💦💦 This is Hilarious Hypocrisy!! 🤣🤣🔥🔥🔥🔥