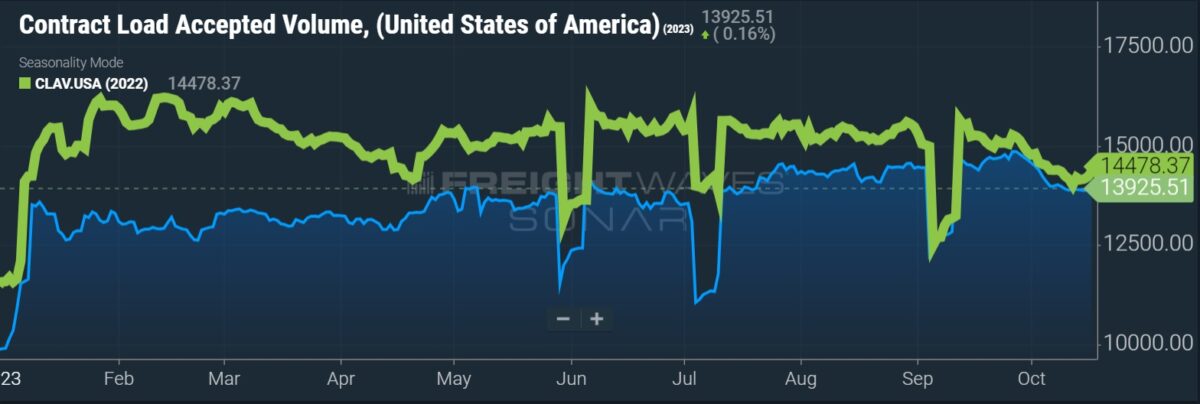
Volumes ticked higher again in September while total freight expenditures declined, according to a Wednesday report from Cass Information Systems.
The shipments subindex of the Cass Freight Index increased 1.7% from August, which was up 0.8% from July. Compared to 2022, the index was down 6.3% in September, which was an improvement from the 10.6% year-over-year (y/y) decline logged in the prior month.
Peak season “is off to a muted start with a slightly improving trend, as expected,” said ACT Research’s Tim Denoyer. “We continue to expect modest y/y growth in consumer spending this holiday season, driven by the acceleration in real disposable incomes, and the ongoing strong labor market.”
He said normal seasonal patterns through the rest of October would result in a 7% y/y decline in shipments for the month, implying a 2% decline from September.
| September 2023 | y/y | 2-year | m/m | m/m (SA) |
| Shipments | -6.3% | -1.8% | 1.7% | 1.7% |
| Expenditures | -25.4% | -9.6% | -0.2% | -1.6% |
| TL Linehaul Index | -9.1% | -5.6% | 0.5% | NM |

Freight expenditures captured on Cass’ freight payments platform in September fell 1.6% seasonally adjusted from the prior month and were off 25.4% y/y. With a modest increase in shipments and a modest decline in expenditures, actual freight rates were likely off 3.3% sequentially. This metric for “market-driven” rates has now declined 1.2% sequentially on average over the last 18 months.
The expenditures subindex includes fuel surcharges and accessorial fees. There is additional volatility in the data set as it includes all modes, meaning changes in mix will impact the readings. Truckload freight accounts for more than half of the freight spend at Cass.
The expenditures subindex has been down approximately 25% y/y in each of the last four months. Compared to the September 2021 reading, it’s down 9.6%.
Soft freight volumes and excess capacity have placed downward pressure on rates, which the report said is “likely to deliver savings to shippers this holiday season.” Shifts in truckload spot rates are usually indicative of a market inflection. Spot rates have bobbled along what may be a bottom for the bulk of the year as fundamentals remain loose.
Normal seasonality moving forward is likely to produce an 18% decline in the expenditures data set this year with a 11% decline expected in the first half of 2024.

Cass’ truckload linehaul index, which excludes fuel and accessorials, ticked up 0.5% sequentially in September, reversing a decline of an equal amount in August. This was the first sequential increase since May 2022.
The index was down 9.1% y/y, which was the smallest decline since February.
“The small increase is more likely a pause than a trend change, but reinforces some anecdotes (also noted in this report last month) of fleets addressing accepted but unacceptable rates. While not likely widespread, this suggests rates are nearing their lows,” Denoyer said.
He said the y/y declines in the TL linehaul data will likely continue to slow even if there are modest sequential declines moving forward.
“With both the shipments component of the Cass Freight Index and the Cass Truckload Linehaul Index rising sequentially this month, the freight cycle is at least starting to flatten out, with smaller y/y declines,” Denoyer concluded. “We continue to expect the freight cycle to turn once capacity tightens, but early signs of 2024 equipment production suggest that may be a while.”
Data used in the Cass indexes is derived from freight bills paid by Cass (NASDAQ: CASS), a provider of payment management solutions. Cass processes $44 billion in freight payables annually on behalf of customers.
More FreightWaves articles by Todd Maiden
- Activist investor looks to unseat Forward Air board, CEO
- Yellow’s equipment may be sold off by auction houses
- Roadrunner’s new service waives shipment costs on late deliveries


