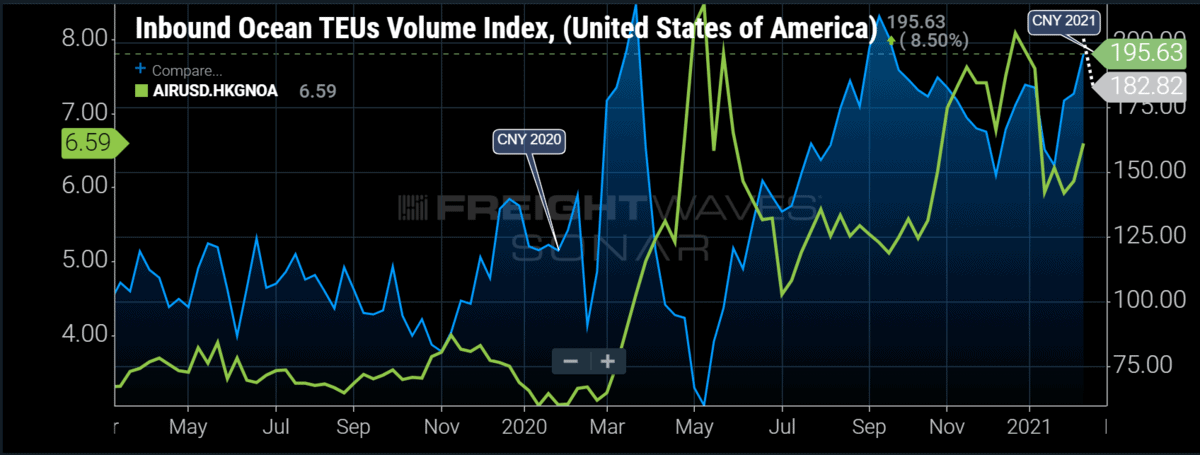
Chart of the Week: Inbound Ocean TEU Index – USA, Transportation Air Cargo Index – Hong Kong to North America SONAR: IOTI.USA, AIRUSD.HKGNOA
Supply chains have fractured under the weight of recent import demand, forcing shippers like Peloton (NASDAQ: PTON) to find pricier alternatives in order to not miss their window of opportunity. Judging from FreightWaves’ new Inbound Ocean TEU Volume Index (IOTI) and the recent Transportation Air Cargo Index (AIRUSD), that is not the only company choosing to fly versus ship goods over the Pacific.
The import boom appears far from over, and it will have implications long after this wave of unprecedented orders subsides. The trans-Pacific trade route has been overwhelmed over the past year as consumers divert their attention to spending on durable goods over travel and leisure services while they spend more time at home.
The Ocean TEU Index measures booking requests for capacity, much like the Outbound Tender Volume Index (OTVI) does for domestic trucking. Not all the requests are accepted, but they are a good indicator of demand and can have leading implications for other modes, such as air cargo in this case. The dotted line indicates booking requests over the next week.
The chart shows spikes in ocean bookings in April and September were followed by jumps in air cargo spot rates a month later. The recent winter surge is showing a slightly tighter connection in the near term.
The Transportation Air Cargo Index measures the price per kilogram on the spot market to move freight through the air in multiple lanes — in this instance, Hong Kong to North America. Normally, spot rates in this lane fall to their lowest points of the year in the winter months of January and February, but that has not been the case so far in 2021.
Air cargo rates from Asia to North America have been elevated compared to previous years since April, thanks to a reduction of passenger capacity and heightened demand for personal protective equipment. Now that the historically cheaper ocean liners are charging record amounts for spot freight just to get a chance at a spot on a ship, the cost gap has narrowed between the two modes since the start of the year — albeit the cost of air is still several multiples higher for many goods.
The much faster service and more guaranteed capacity can justify the increase in cost, especially when time is of the essence when capturing market share.
Forecasting demand has become a huge problem for companies like Peloton and other goods providers that have received a tailwind from the COVID pandemic. It is unclear what will happen to this demand once restrictions ease and people are able to do more outside their homes.
Transportation providers have the same challenge. Importers are expecting to take massive rate hikes on their contracts even though many like Maersk CEO Patrick Jany expect easing after the first quarter. While supply and demand dictate the rates must increase, the effects of rapid rate expansion are not good in the long term if demand wanes too much.
The domestic trucking market learned this lesson in 2019 as carriers took huge rate increases and invested in fleet expansion, which led to an oversupplied market and multiyear highs for trucking bankruptcies. Gains in rates were mostly erased in the next year.
Reshoring — moving production to another country — is another long-term result of the current environment. As if geopolitical forces were not enough reason for companies to look for other sourcing locations outside China, the capacity crunch is adding to that incentive. A recent survey by BDO found 24% of the companies are looking to move their supply chains to another country within the year.
Restructuring supply chains will have a lasting effect on logistics networks. If production centers move away from Asia and into other parts of the world such as the U.S., there will be a change in balance of consumption versus production.
If more production were to move to Europe, as the survey suggests, Los Angeles could fade as a hub for freight activity as imports enter through the East Coast. A large shift of balance could dramatically change freight pricing over the next several years.
About the Chart of the Week
The FreightWaves Chart of the Week is a chart selection from SONAR that provides an interesting data point to describe the state of the freight markets. A chart is chosen from thousands of potential charts on SONAR to help participants visualize the freight market in real time. Each week a Market Expert will post a chart, along with commentary, live on the front page. After that, the Chart of the Week will be archived on FreightWaves.com for future reference.
SONAR aggregates data from hundreds of sources, presenting the data in charts and maps and providing commentary on what freight market experts want to know about the industry in real time.
The FreightWaves data science and product teams are releasing new data sets each week and enhancing the client experience.
To request a SONAR demo, click here.


