The highlights from Tuesday’s SONAR reports are below. For more information on SONAR — the fastest freight-forecasting platform in the industry — or to request a demo, click here. Also, be sure to check out the latest SONAR update, TRAC — the freshest spot rate data in the industry.
Market watch
Los Angeles
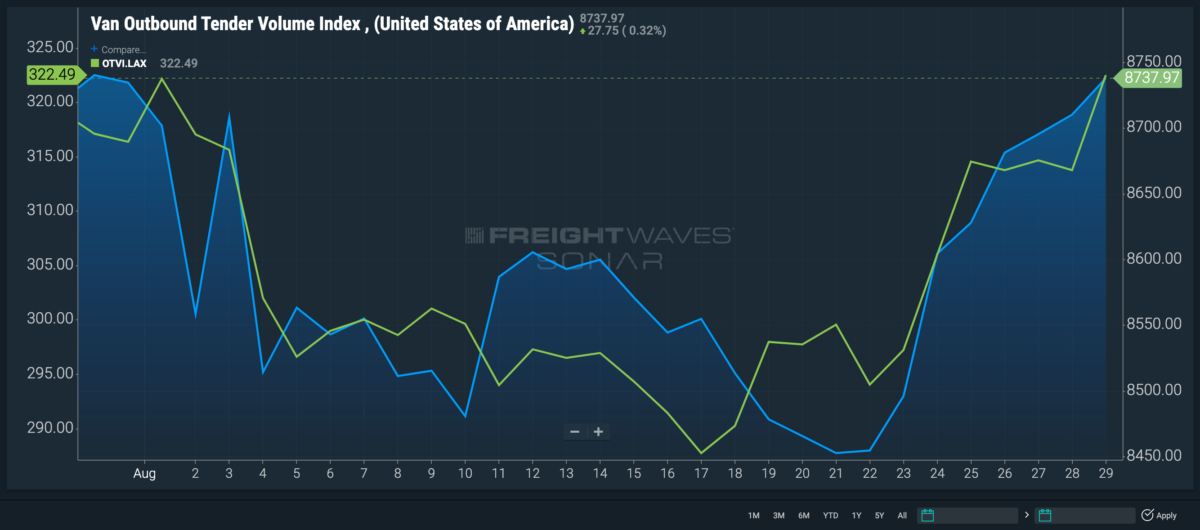
As more containerized imports are being shipped to the East Coast in an effort to ease congestion at the West Coast ports of Los Angeles and Long Beach, California, dwell times at the port of LA hit below four days on Aug. 14 — the lowest they have been since April 2021.
I’ve said it before and I’ll say it again: Southern California is the heartbeat for outbound truckload volume in the U.S. Ironically enough, days after this decrease in dwell times began in LA, overall outbound dy van volume across America started to pick up. It is important to note that other markets, such as Detroit, are contributing to this as well, but the percentage change in LA holds far greater value than others.
Since Aug. 17, outbound truckload volume in LA is up 12%, and dry van outbound tenders across the U.S. have risen almost 3.5% in the last week. However, rejections in LA remain repressed at only 2%, among some of the lowest rates in the country.
In LA’s neighboring market, Ontario, California, outbound tender volumes increased steadily throughout August, increasing 14.1% since the first week of the month. However, rejection rates are just the same as they are in LA at 2%.

Savannah, Georgia
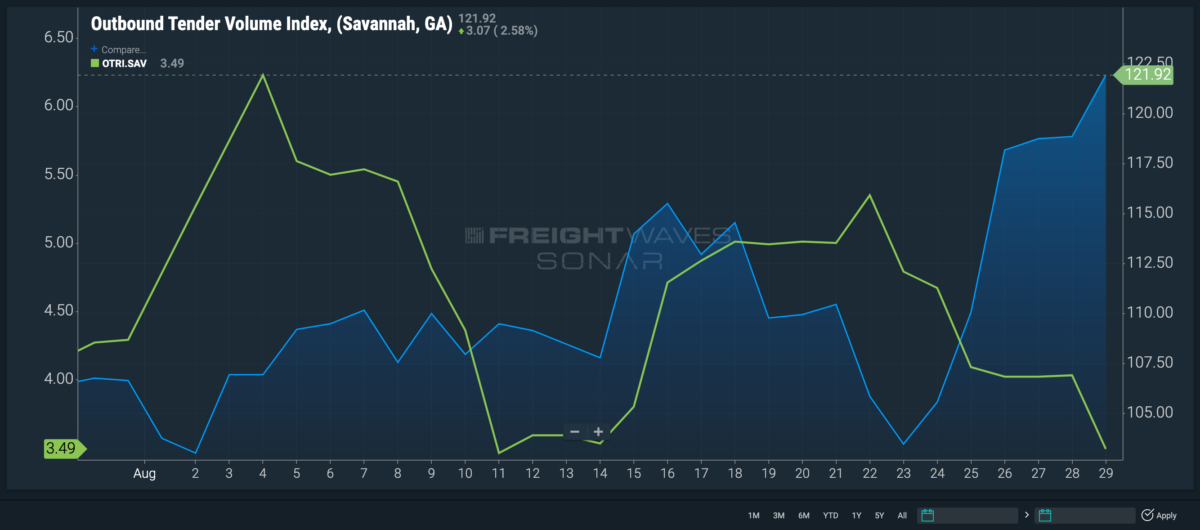
On the East Coast, the Port of Savannah’s imported twenty-foot equivalent units are 4.6% higher on average in August than July. The increase placed containerized import levels to the southeastern port at the highest they have been since FreightWaves SONAR began tracking the data in 2018.
Largely due to this increase in imports, outbound truckload volumes are up this month, rising 18.3% since Aug. 2.
Outbound volumes may be increasing, but capacity is remaining compliant to contracted freight. The Outbound Tender Reject Index for Savannah is down 280 basis points since the start of the month to 3.4% — the lowest it has been all year.

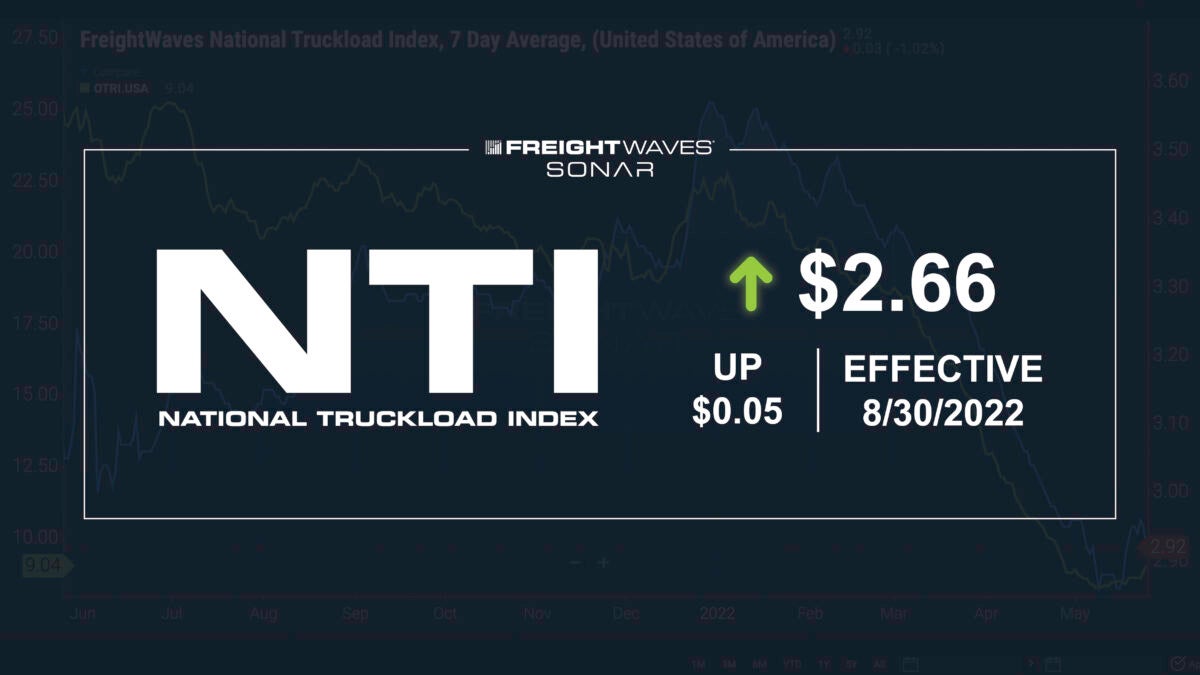
NTI as a point of reference
The National Truckload Index is a daily look at how spot rates in specific lanes hold up in comparison to the national average, giving carriers and brokers an idea of which lanes to gravitate toward or avoid.

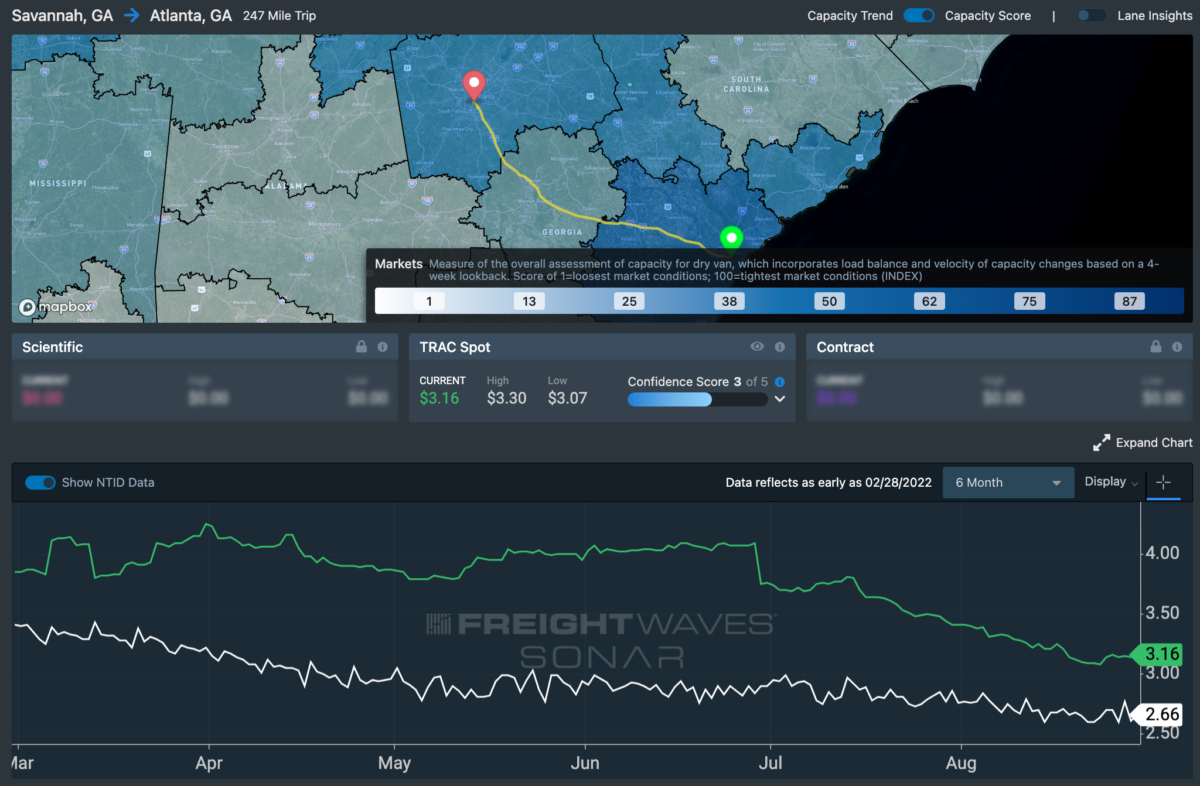
Lane to watch: Savannah to Atlanta
Spot rates in this lane are down 25 cents from the start of the month but still remain 50 cents above the national average. Rates seem to have found a floor at $3.16 a mile, but capacity is loosening in both markets. Rejections in Atlanta are down roughly 100 bps to 4.4%, and in Savannah they have fallen to 3.4%, indicating less spot market opportunities that will more than likely result in rates falling even further.
Outbound volume from Atlanta is up 4.1% since Aug.17, presenting the probable outcome of carriers being able to book at the ends of the road.


