The highlights from Monday’s SONAR reports are below. For more information on SONAR — the fastest freight-forecasting platform in the industry — or to request a demo, click here. Also, be sure to check out the latest SONAR update, TRAC — the freshest spot rate data in the industry.
Market watch
The congestion at the ports and how much volume they’re processing has been a topic of interest among industry professionals and even outside observers. Most notable in these discussions are the ports in California. They have been experiencing high dwell times and a harbor of ships in limbo as the ports try to catch up.
According to a story by Greg Miller, FreightWaves senior editor and maritime writer, on Friday, 24 containerized ships were waiting to port in either LA or Long Beach.
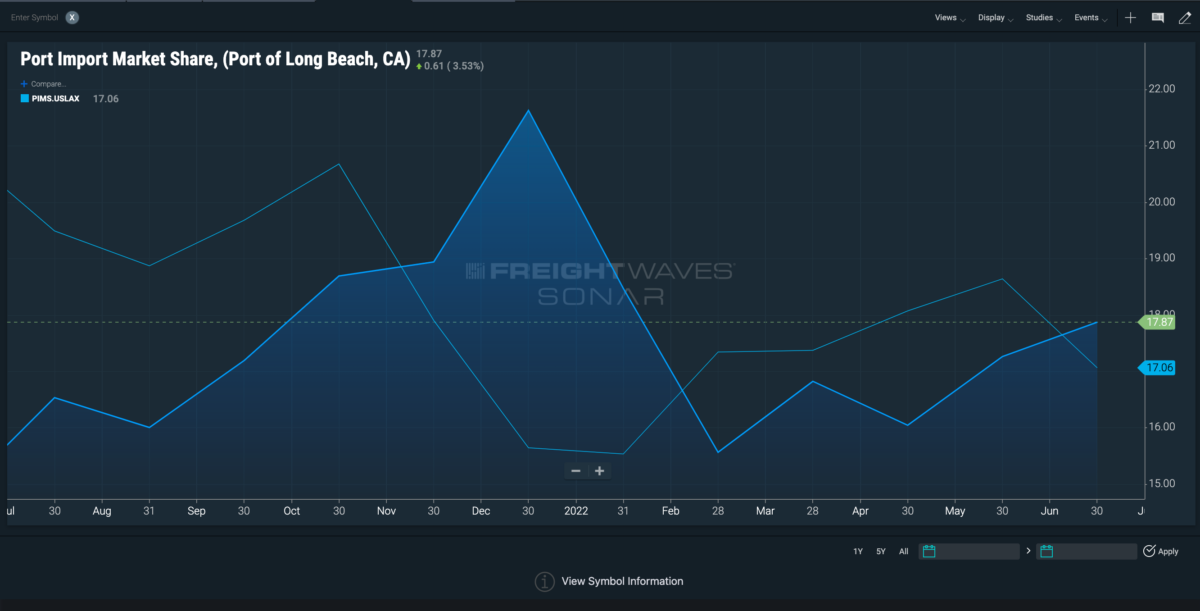
With this in mind, today we’ll take a look at the import market share of each of the ports.
The ports of LA and Long Beach are the most volatile in terms of market share, intersecting, at times trading values, and rising to 20% before dropping to 15% — usually rising and falling in correlation to one another, with LA being the first to show the signs.

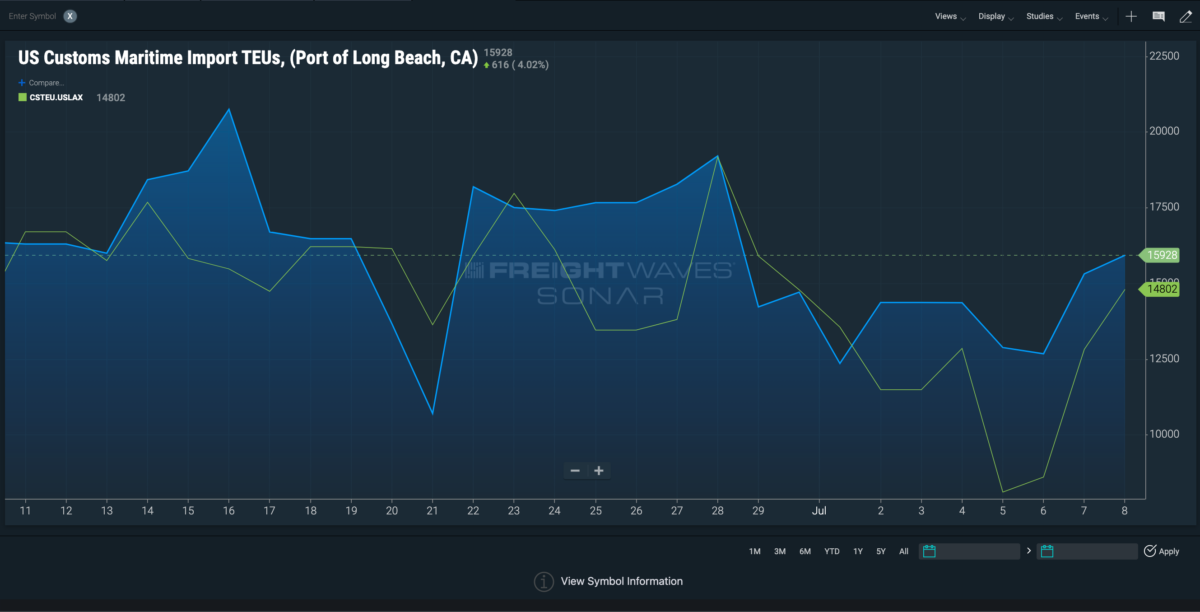
As of June 30, LA owned 17% market share and Long Beach had 17.8%. Overall imported twenty-foot equivalent units that have cleared customs remain the highest in these two ports. As of Friday, Los Angeles customs maritime imports hit 14,802 and Long Beach customs cleared 15,928 TEUs.

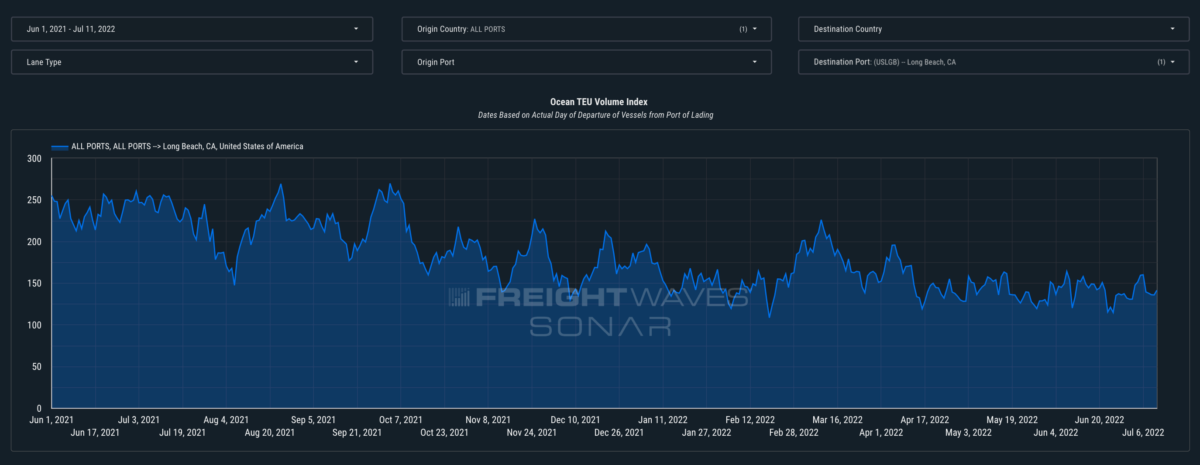
The Ocean TEU Volume Index within SONAR’s Container Atlas reflects a drop in TEU volumes between July 11, 2021, and today at 21.9%. Meanwhile the Port of Long Beach has experienced a 42.8% decline in the same time period.

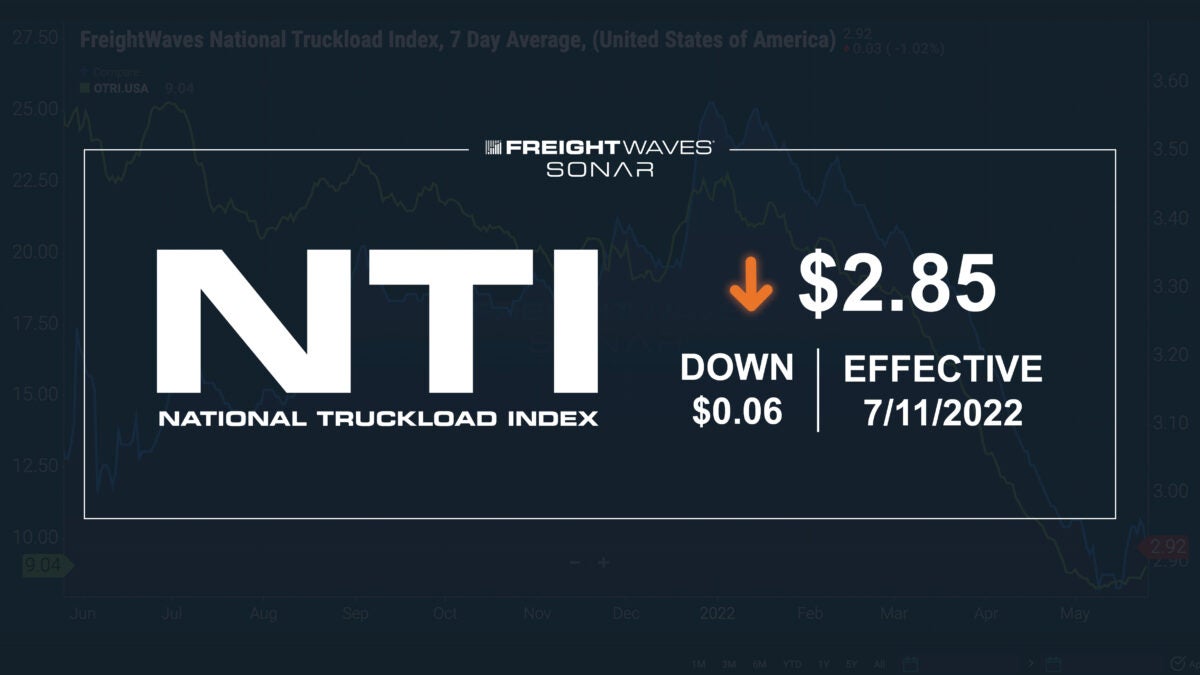
NTI as a point of reference


