The highlights from Tuesday’s SONAR reports. For more information on SONAR — the fastest freight-forecasting platform in the industry — or to request a demo, click here. Also, be sure to check out the latest SONAR update, TRAC — the freshest spot rate data in the industry.
Lanes to watch
By Zach Strickland, director, Freight Market Intelligence
INDIANAPOLIS to DALLAS
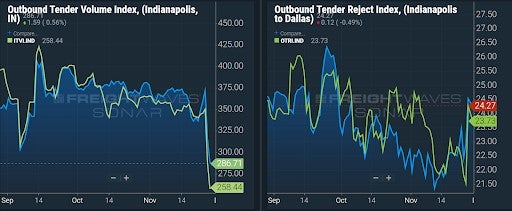
Overview: Rejections likely to increase as the Headhaul Index surges 32% w/w.
Highlights
- Indianapolis outbound tender volumes are down 14% w/w, signaling that demand for outbound capacity has decreased from the lead up to the Thanksgiving holiday.
- The Headhaul index in Indianapolis is up 32% w/w, signaling capacity is likely to tighten from the growing imbalance between outbound and inbound volumes.
- Indianapolis outbound tender rejections are up 91 bps w/w, but are likely to move higher as a result of the large w/w increase in the Headhaul Index.
What does this mean for you?
Brokers: Take notice of the 26% increase in the Headhaul Index w/w, as well as the 91 bps increase in outbound tender rejections w/w. Even though outbound volumes are down 14% w/w, inbound volumes have actually dropped at a faster pace; thus, causing the major increase in the Headhaul Index w/w. With fewer trucks headed into the Indianapolis market, if outbound volumes level off, or reverse and head higher, capacity will likely tighten rapidly and put significant upward pressure on spot rates.
Carriers: Stay firm on your rates out of Indianapolis. The increase of over 26% in the Headhaul Index w/w, coupled with the 96 bps increase in outbound tender rejections is likely to cause greater upward pressure on spot rates. Even though “Black Friday” is behind us and volumes are down 14% w/w, we expect outbound volumes to remain strong for at least a couple of more weeks. Keep a close eye on outbound tender rejections, and if they rise higher in the coming days, adjust your pricing higher to capitalize on tightening conditions.
Shippers: Your shipper cohorts in Indianapolis have increased tender lead times to 3.3 days on average. This is a strong increase w/w, and is a key signal that shippers are feeling the tightening of capacity for the holiday season. Historically, shippers have lead times between 3.5 and 4 days during periods of extremely tight capacity, but it might be wise to get closer to 4.5 days this year to provide your shipments a better chance of securing capacity.
ATLANTA to DALLAS
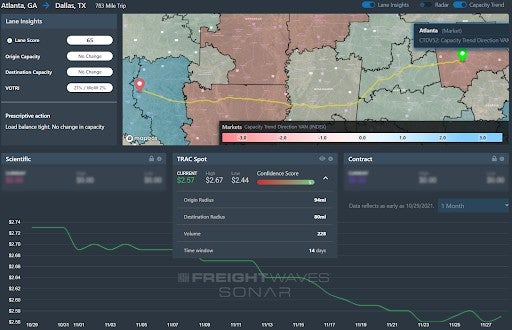
Overview: Market Dashboard shows that dry van spot rates are currently below door-to-door domestic intermodal spot rates.
Highlights
- The van tender rejection rate of 20.9% in the lane is 510 basis points higher than the 15.8% tender rejection rate for all outbound Atlanta van loads.
- The door-to-door intermodal spot rate to move 53’ containers most recently quoted by the Class I railroads in the lane is $2.76/mile, including fuel surcharges.
- The average spot rate that brokers are paying for dry van capacity in the lane is $2.57/mile, including fuel surcharges, with $2.67/mile and $2.44/mile representing the buy-rates rates in the 67th and 33rd percentiles, respectively. All rates include fuel.
What does this mean for you?
Brokers: Prioritize covering loads in the lane over most other outbound Atlanta loads given some carriers’ preference for heading to a freight market that is currently tighter than Dallas. When negotiating with carriers, stress that the Dallas Van Headhaul Index of 49 suggests that it should be very easy to get reloaded in Dallas.
Carriers: Dry van carriers should consider heading to Dallas to be a mixed bag. While Dallas is a Headhaul market (with a current Van Headhaul Index reading of 49), Dallas’ van outbound tender rejection rate of 16.6%, indicates the market is not as tight as most freight markets currently given the current national van tender rejection rate of 19.4%.
Shippers: Spot shippers will find it more economical to use the highway rather than rail intermodal. Shippers should keep lead times extended to at least 3 days, given the current tender lead times for outbound long-haul Atlanta loads and inbound long-haul Dallas loads of 2.7 days and 3.7 days, respectively.
SEATTLE to STOCKTON (California)
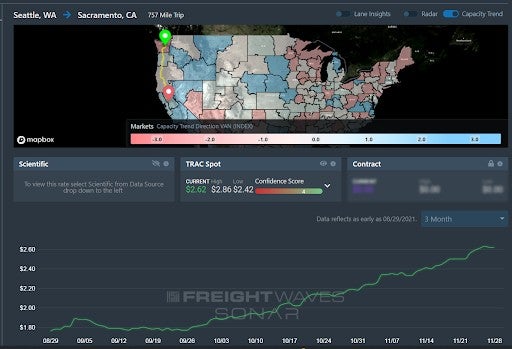
Overview: Rejection rates spike as carriers head to the spot market in the Northwest.
Highlights
- Spot rates have been steadily increasing in this lane since the end of September, according to FreightWaves TRAC. Average all-in rates have grown from $1.80 per mile on Sept. 26 to $2.62 this week.
- Tender rejection rates increased from 12% to 17% this past week out of Seattle, while lane specific rejection rates to the Stockton market pushed over 20% for the first time since May.
- Stockton’s outbound volumes are trending higher as rejection rates have fallen since this summer. There is a slight indication that capacity may be retightening as rejections have been averaging higher in November.
What does this mean for you?
Brokers: Expect the spot market to control capacity this week with spot rates surging to seasonal highs. This is still a well-supplied market for most contract freight, but it seems carriers are allocating more capacity to the spot market over the past few months in the Northwest to take advantage of all the seasonal freight.
Carriers: Allocate more capacity to the spot market in this lane if you are familiar with the requirements of handling the harvest freight such as Christmas trees. The region has been inundated with rain after an extremely hot and dry summer. This makes harvesting extremely difficult. In the long run it may not be the right move if you are not well equipped.
Shippers: Give your carriers a quick check and make sure lead times are above two days in the Northwest over the next month. Rejection rates are abnormally high in this lane as carriers are taking advantage of high margin spot freight while they can. Most contracted accounts should still be ok, but this is the time of year where you cannot take capacity for granted in this region.
Watch: Shipper Update
Los Angeles to Atlanta: Dry van lane
By Travis Winnon, SONAR account executive
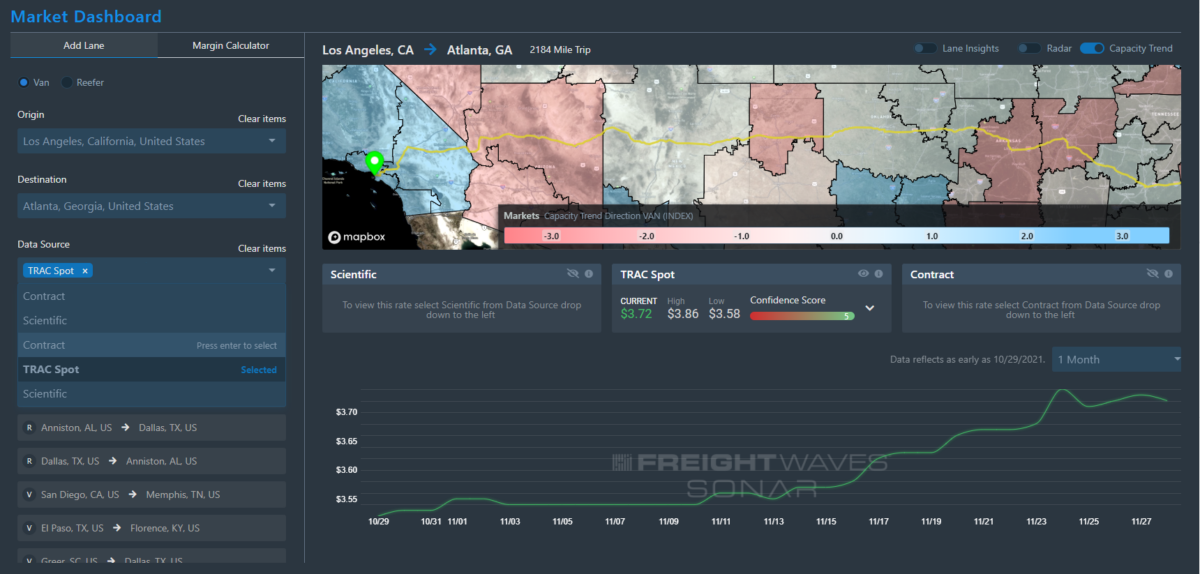
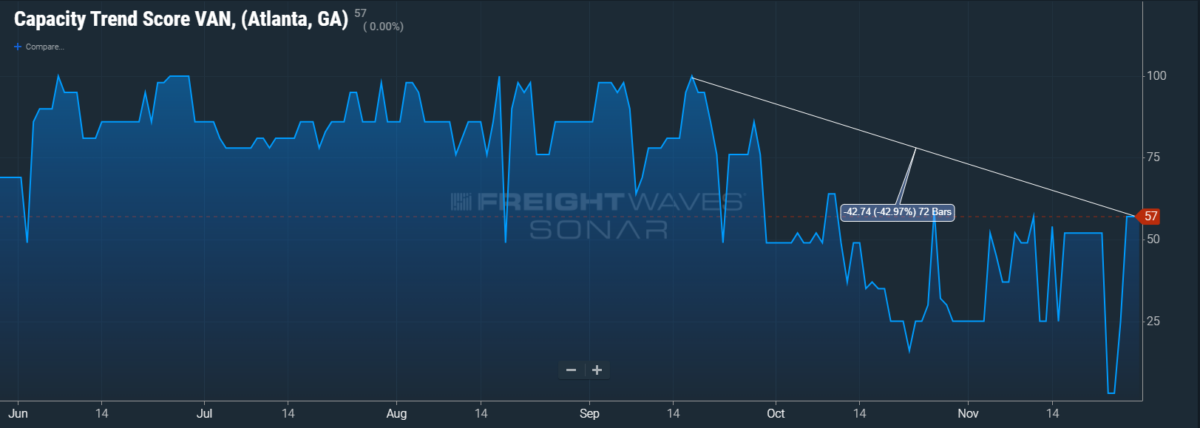
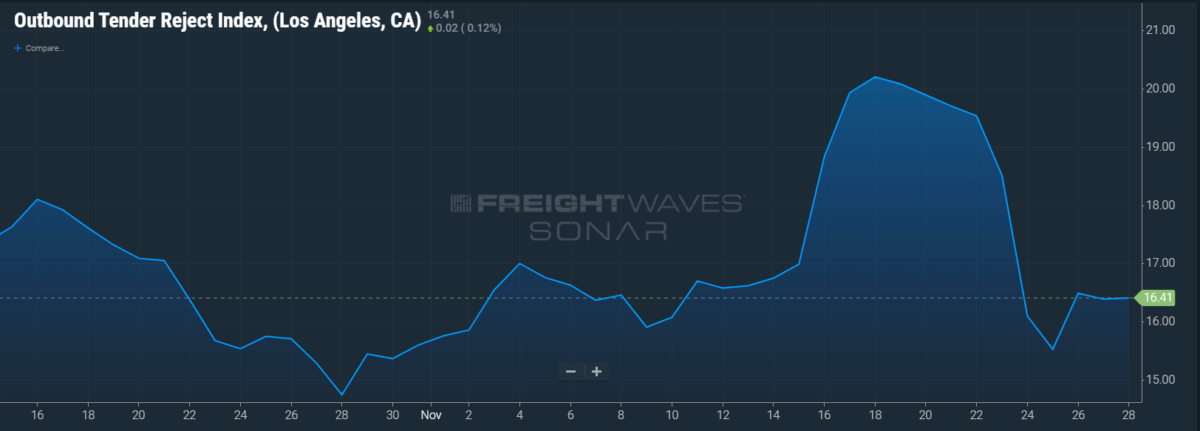
This lane has been heating up since before Thanksgiving and peaked over the holiday weekend due to a few contributing factors:
- Thanksgiving holiday
- Declining capacity in Atlanta since September after a very strong run this summer
- A spike in LAX tender rejections starting on Nov. 14
The $0.20 rise in rates could be a temporary holiday spike, but the declining Atlanta market conditions should be monitored by anyone with an involvement in this lane.
Watch: Carrier Update
Tree map: Outbound tender market share
By Zach Strickland
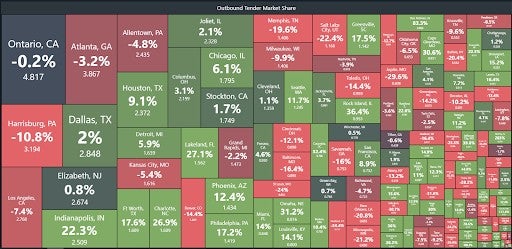
The Outbound Tender Market Share Index (OTMS) shows the Ontario, California, market holds a commanding lead over the Atlanta market in terms of total tender volumes in the U.S.
The large difference between these two markets illustrates just how imbalanced freight continues to be in the U.S.
The percent underneath the market name is the year-over-year change in value, while the number below the percent is the current index value.
Ontario is the origin for 4.82% of all the outbound tender volume in the U.S., which is about 0.2% below where it was a year ago.
It is important to note that this index includes both rejected and accepted tender volumes.
Ontario’s outbound rejection rate is currently around 16%, whereas it was over 25% at this time last year — indicating there are actually far more loads moving under contracted rates this year versus last year out of this market.


Daniela Hoch
I am Earning $81,100 so Far this year working 0nline and I am a full time college student and just working for 3 to 4 hours a day I’ve made such great m0ney.I am Genuinely thankful to and my administrator, It’s’ really user friendly and I’m just so happY that I found out about this
HERE………….>> http://www.EarnApp3.com