


The highlights from Friday’s SONAR reports. For more information on SONAR — the fastest freight-forecasting platform in the industry — or to request a demo, click here.
Lanes to watch
By Zach Strickland, director, Freight Market Intelligence
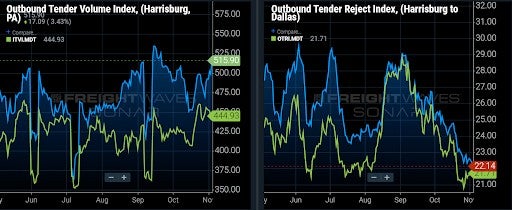
HARRISBURG (Pennsylvania) to DALLAS
Overview: Capacity is likely to tighten significantly in the days ahead as the Headhaul Index surges 38% week-over-week (w/w).
Highlights:
- Harrisburg outbound tender volumes are up 8% w/w, signaling that demand for capacity is increasing.
- The Headhaul Index in Harrisburg is up 38% w/w, signaling that capacity is likely to tighten.
- Harrisburg outbound tender rejections are up 64 basis points (bps) w/w, but are likely to move higher because of the growing imbalance between volumes.
What does this mean for you?
Brokers: You are likely to see capacity tighten in the days ahead even though outbound tender rejections are relatively flat w/w. The huge surge of 38% w/w in the Headhaul Index has been driven primarily by a 8% increase in outbound volumes, and is signaling that this growing imbalance in volumes could cause a significant tightening of capacity. Therefore, rates in the spot market will likely be experiencing substantial upward pressure in the days ahead, so price your spot freight accordingly.
Carriers: The Harrisburg market’s pricing power is shifting back into your favor as outbound volumes are trending toward what could be a record high for 2021. Most brokers and shippers are likely already feeling capacity tighten, so try to stay firm on your rates and capitalize on your spot market opportunities as outbound volumes rise.
Shippers: Your shipper cohorts in Harrisburg are averaging 3.2 days in tender lead times, which are close to their year-to-date highs of 3.4 days (reached on Oct. 25). If the Headhaul Index continues to increase, you will need to have your tender lead times between 3.5 and 4 days to ensure that you are able to source capacity effectively during these tightening conditions.
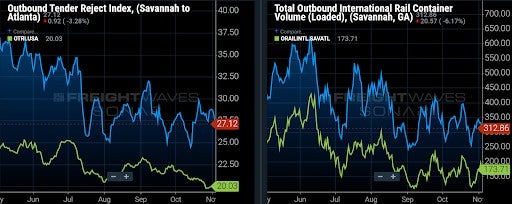
SAVANNAH (Georgia) to ATLANTA
Overview: Brokers should prioritize covering this lane as tender rejections remain elevated.
Highlights:
- The tender rejection rate in the lane declined 270 bps in the past two weeks to a still-high 27.2%.
- This fall, international intermodal volume has ranged from just over 100 containers/day to just over 200 containers/day (174 containers/day in the past week). That is far below the 200-400 international containers/day that moved in the lane during the first half of the year.
- In recent weeks, Atlanta has become a backhaul market with a Headhaul Index of -15, down from a positive Headhaul Index throughout the summer and as recently as late September.
What does this mean for you?
Brokers: Covering this lane may be a challenge with Savannah being such a headhaul market and with more highway demand than normal since intermodal capacity has been scaled back. Nevertheless, you may want to reduce your bids in this lane given the meaningful drop in the tender rejection rate in the lane in the past two weeks.
Carriers: The half-day trip puts you in one of the busiest freight markets, but also one that is currently a backhaul market with an outbound tender rejection rate that is 230 bps below the national average. Therefore, if heading to Atlanta, be sure to get compensated for the characteristics of your destination market.
Shippers: The decline in international intermodal volume, despite the continued elevated Savannah import volume, suggests that container ship lines have become less willing to send containers inland to preserve container availability. Therefore, shippers are more likely to have to make arrangements on the highway and capacity remains tight in the lane.
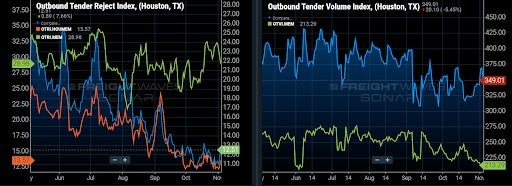
HOUSTON to MEMPHIS
Overview: Houston’s outbound rejections jump but are still on a downward trend.
Highlights:
- Houston’s outbound tender rejection rate has jumped 2.5 points to start the week, and seem to have hit a floor around 11% after topping 25% in the summer. Demand has been relatively consistent since Labor Day.
- Lane-specific rejection rates to Memphis have moved tightly with the overall market and continue to be below Houston’s average.
- Memphis’ outbound rejection rate has averaged higher in October than in September, and continues to be well above the national average even though demand is waning.
What does this mean for you?
Brokers: Expect slight upward pressure on rates this week in this lane, but most rates should be in line with the previous week. Contract rates have obviously increased significantly out of Houston over the past three months, so they will help provide a buffer against any sharp downward spot rate movement.
Carriers: Look for spot moves out of Memphis if you have loads moving in this lane. Memphis’ outbound rejection rates are still high even as tenders fall, meaning capacity and/or rates have not recovered out of this market.
Shippers: If your compliance rates have not improved since this summer to the levels displayed in SONAR in this lane, consider increasing your rates. A large increase is probably not needed as Houston is normally a well-supplied area.
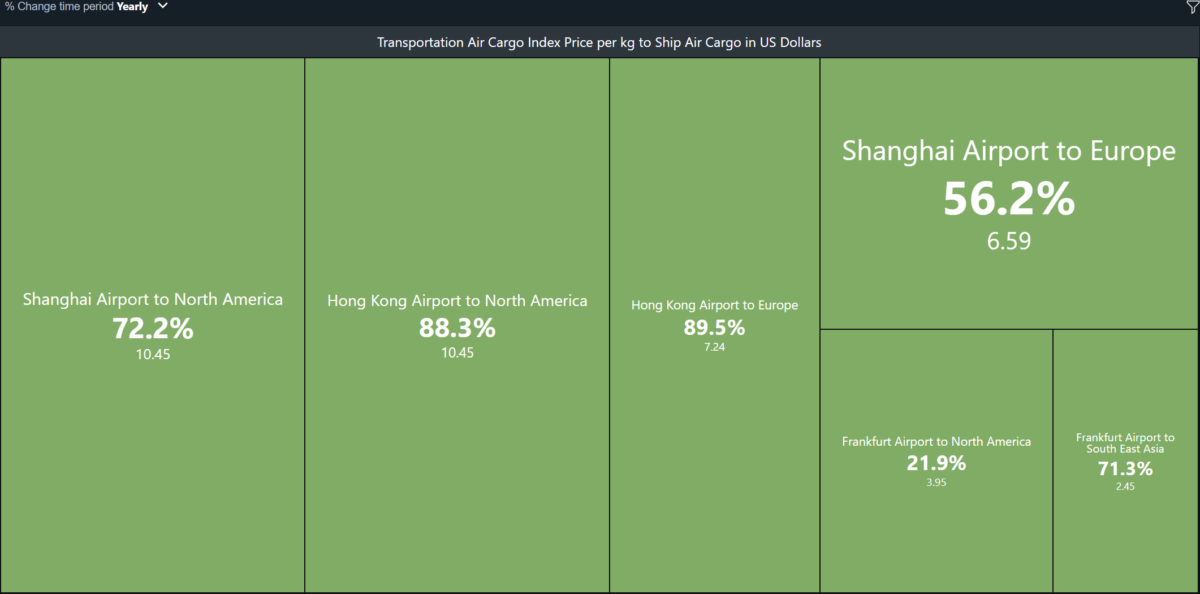
Air cargo rates for major trade lanes
From The Stockout newsletter by Mike Baudendistel (click here to subscribe)
Air cargo rates are up sharply, year-over-year, in the major trade lanes, as shown in the SONAR chart below. Cosmetics are often transported via air cargo due to their high value, small size and service requirements (some cosmetics melt under high temperatures, for instance).
Watch: Shipper Update
Two SONAR indices with a tight correlation
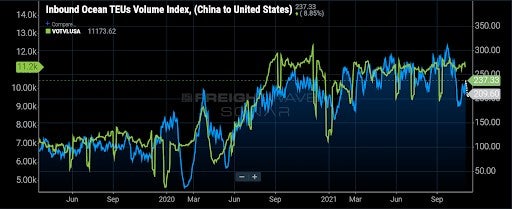
Inbound Ocean TEUs Volume (China to U.S.) vs. Van Outbound Tender Volumes (USA)
By Zach Strickland
The Inbound Ocean TEUs Volume Index was created to give users a real-time view of container volumes moving between origins and destinations around the world. This index is a 10-day moving average, and measures the amount of twenty-foot equivalent units (TEUs) departing on vessels from origin on a given day.
Each granularity of this ticker is indexed to itself with a baseline of 100 on Jan. 1, 2019. This index also includes a 7-day forward look (white dotted line) of confirmed TEU volumes that are expected to move based on their estimated time of departure.
Then, as the estimated times of departures for these TEU volumes become actual times of departure (when the vessel departs its berth at origin), they are included in the calculation for the index value on that specific day.
This can be one of the best ways to monitor containerized volumes that are on the water before they ever arrive at their anticipated destination.
Therefore, this index provides users with one of the industry’s best leading indicators for container volumes that will need surface-side transportation once they arrive.
Since TEU volumes from China to the U.S. comprise such a large amount of dry van truckload volumes once they arrive at their destination, the two indices hold a very tight correlation to one another, and can help provide guidance into anticipated surface-side transportation demand for the future.
Watch: Carrier Update
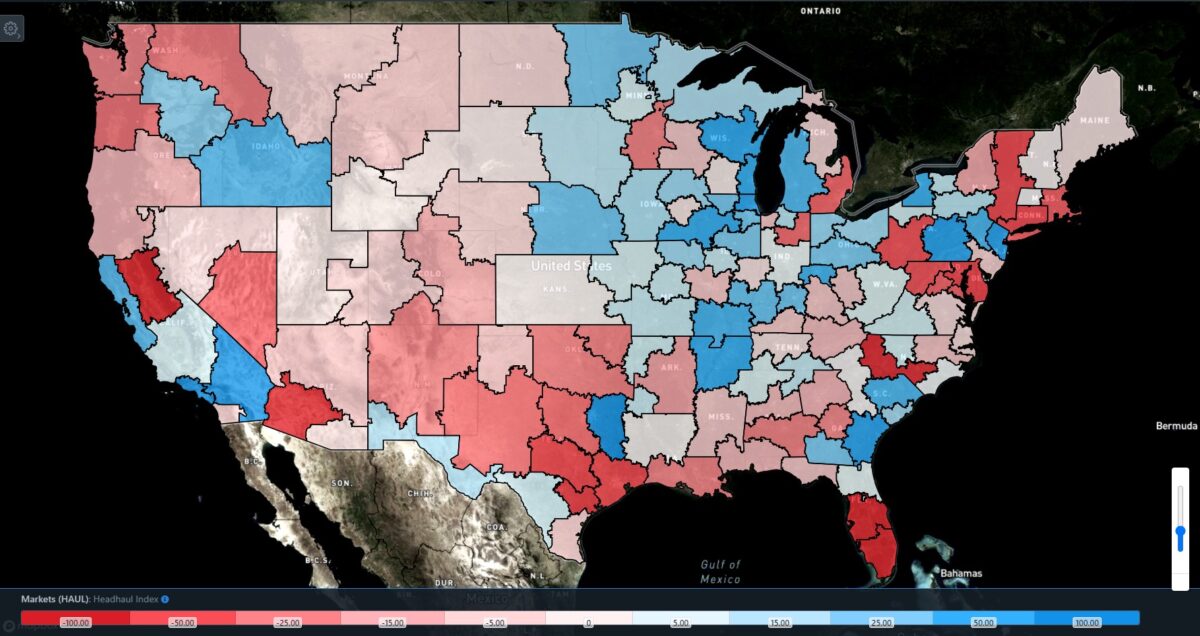
SONAR tip: Headhaul Index explained
By FreightWaves SONAR staff
Headhaul Index (HAUL): Calculates the difference between the Outbound Tender Volume Index (OTVI) and the Inbound Tender Volume Index (ITVI). By measuring the flow of outbound and inbound freight in a market, SONAR users are able to measure capacity over time, based on the inbound and outbound trucks that are moving freight.
Example: On June 9, OTVI.ATL was 594.39 and ITVI.ATL was 609.48.
| OTVI.ATL minus | ITVI.ATL equals | HAUL.ATL |
| 594.39 – | 609.48 = | -15.09 |
The Headhaul Index (HAUL) is a good indicator of capacity changes. For example, if the HAUL score is increasing, that suggests a tightening of capacity in the specified market. However, if the HAUL score is decreasing, it signifies that available capacity is growing. SONAR users can drill down in the Headhaul Index to specific regions and market granularity.
tanya33
●▬▬▬▬PART TIME JOBS▬▬▬▬▬● I am making $165 an hour working from home. i was greatly surprised at the same time as my neighbour advised me she changed into averaging $ninety five however I see the way it works now. I experience masses freedom now that i’m my non-public boss. that is what I do…. http://www.webwork8.com/