Everyone wants better data, and some find access to it, but not everyone gets the human touch, especially for no additional cost. Often, even the best “dry” data requires the “wet” analysis and interpretations of the humans “behind the wheel.” Much like Bloomberg equipped their finance terminals with business-minded journalists, FreightWaves is now offering the services of their analysts as a value-add to their SaaS Sonar service.
CEO and founder, Craig Fuller, says, “As an organization that values building on a strong community, we want our customers to get the human touch, as well as the technical. Our goal is to take our data and combine it with human intelligence to provide real-time insights and analysis on the trends happening before our eyes. Customers don’t just want data, they want to be able to interpret and have actionable data.”
Zach Strickland will lead the team as the “Sultan of SONAR.” Strickland will curate the open, monitored channel and lead the group of data, economic, and editorial analysts, John Kingston, Ibrahiim Bayaan, Brian Straight, John Paul Hampstead, Chad Prevost, Brad Hill, Sam Tibbs, Daniel Pickett, Ken Smith, and Michael Vincent, among others.
With a degree in Finance, Strickland spent the early part of his career in banking before transitioning to transportation in various roles and segments, such as truckload and LTL. He has over 13 years of transportation experience, specializing in data, pricing, and analytics.
The discussion practices will be compliant with industry regulation. The channel is not meant to be like a freeform Facebook or Reddit group. It is created to be a productive and supportive community helping to push the needle forward.
FreightWaves’ industry-leading coverage
FreightWaves boasts some of the top minds in the freight business with five CFAs, four PhDs, and a team that has managed nearly $60B of truckload freight a year.
The company is the number one source for helping participants navigate the freight markets, through its news service and SONAR platform. The company is also the founding organization and sponsor behind BiTA (Blockchain in Transport Alliance), the transportation industry blockchain forum, think tank, and standards organization. Also, we are the creator of the world’s first freight futures contracts that help organizations with exposure to U.S. trucking rates to hedge and trade exposure.
FreightWaves provides actionable outcomes to participants in the $720B U.S. trucking market, with articles generating more than 750,000 page-views a month, securing FreightWaves as the top news source to the freight markets, globally.
Pageviews and time on-site rank higher than any other site in the industry. FreightWaves readers spend an average of 5:45 minutes per visit versus the industry average of 2:12 per visit. Readers are not only visiting, but engaging in the data and insights.
What SONAR is and is not
SONAR is not a pricing tool. There are plenty of excellent pricing tools already out there. SONAR is about gaining access to market data and predictive analytics to see where prices are moving and help companies make business decisions.
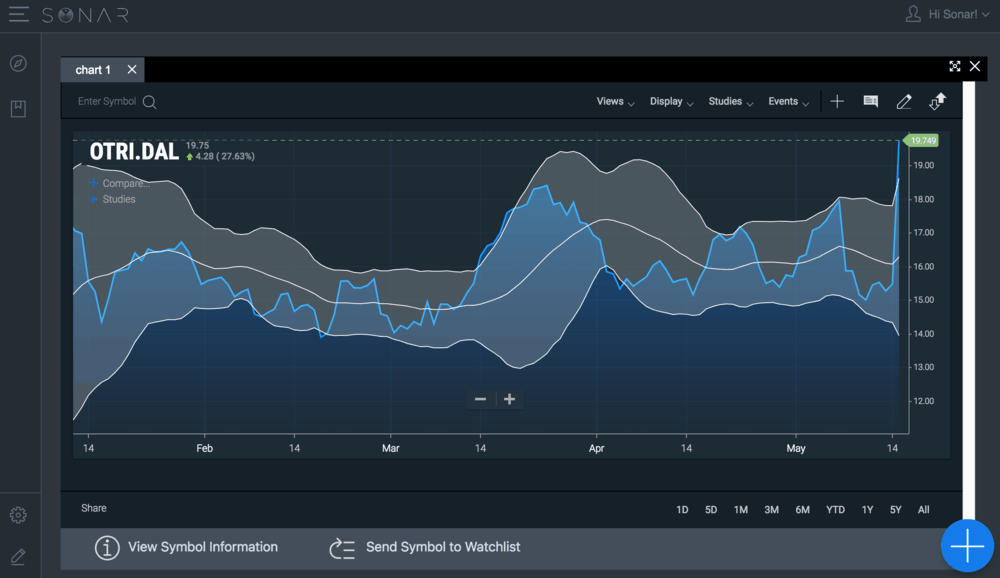
SONAR users can display information in the form of a heat map or a chart. Current indices fall in three categories: fuel indices, used truck prices, and trucking activity indices. Fuel indices include the weekly DOE diesel price per gallon, tracked nationally, and daily diesel truck stop actual price per gallon, tracked by market. Sonar tracks and displays the monthly national average prices for three, four, and five year-old trucks.
National heat maps displaying turndowns and tender lead times can be generated to help companies quickly identify which market points have an excess or a lack of capacity.
Other truck activity indices include tender lead time (TLT), DAT Freight Barometers for dry van, reefer, and flatbed, and various CASS freight indices. The FreightWaves data science team created the TLT index as a way to measure shippers’ attitudes toward market volatility. The TLT is aggregated daily by market and is measured in days, tracking the duration between when a load is tendered by a shipper and when the shipper wants the load picked up.
Finally, there are indexes like commodity flows on a market level, so that a SONAR user can quickly see net flows of coal, sand, meat, lumber, gravel, etc. Container box prices from China and Europe to the West and East Coasts of the U.S. can also be charted on a weekly basis so that shippers and transportation providers can get a sense of maritime supply and demand.
Volatility in the freight market is expected to get worse as the market becomes more transparent, and company executives want to understand what the impact of technology, economic activity, fuel, technology, and weather have on their business.
Stay up-to-date with the latest commentary and insights on FreightTech and the impact to the markets by subscribing.


