“Our ships are still chockablock full — that’s a good sign,” said Rolf Habben Jansen, CEO of Germany ocean carrier Hapag-Lloyd, during the company’s quarterly call earlier this month.
He wasn’t referring to all of the company’s ships, just those serving Latin America. Most of the world’s container trades have sunk back toward pre-COVID volumes and pricing. Most of the world’s ships are not chockablock. The South America trade is, at least temporarily, an exception.
“It seems to be a bit more robust than some of the others,” said Habben Jansen. “We have secured a very significant chunk of our business on contract. All in all, we’re happy with this trade.”
Freightos spot indexes
Spot rates fell back first in the trans-Pacific and Asia-Europe trades. The trans-Atlantic headhaul — Europe to the U.S. — held up much longer than the trans-Pacific or Asia-Europe but it too has now largely normalized.
Rate curves across the world’s container trades have followed virtually the same pattern but to different degrees and with different timing. Ascents and descents didn’t happen simultaneously and have varied in size.
The Europe-to-South America market (which is more of a backhaul in terms of volume) is coming down from the peak more slowly, so rates are still considerably higher than in the pre-COVID “normal.”
The Freightos Baltic Daily Index (FBX) for Europe-South America West Coast assessed the average spot rate at $4,184 per FEU on Wednesday. That’s half of peak levels reached in mid-2022, but it’s still 3.1 times higher than rates at this time in 2019, pre-COVID. This index has been roughly flat for the past three months.

FBX’s Europe-South America East Coast spot assessment on Wednesday was $2,505 per FEU, more than double pre-COVID levels. This route hit a peak much later than other trades. As recently as February, it was at $4,000 per FEU.

Xeneta short-term and long-term indexes
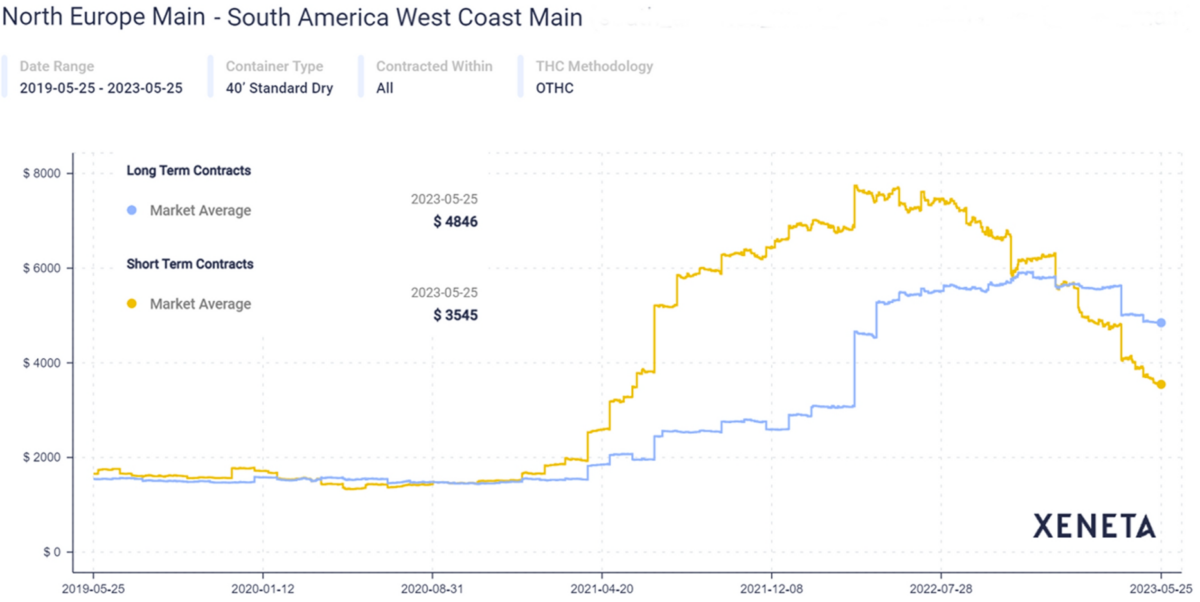
Norway-based Xeneta tracks both short-term and long-term rates. It shows average short-term (spot) rates for North Europe to South America’s west coast at $3,545 per FEU as of Thursday, 2.1 times rates at this time in 2019, pre-COVID.
Hapag-Lloyd’s Habben Jansen pointed to the importance of contract rates, and Xeneta’s data highlights the upside. Carriers locked in high contract rates at the beginning of this year, with average long-term rates on this route now at $4,846 per FEU, 3.1 times pre-COVID levels and 37% higher than average spot rates.
The spread between long-term and short-term rates has widened over recent weeks — the same dynamic seen in the trans-Pacific starting in mid-2022.

Xeneta’s data shows a similar rate pattern, albeit to a lesser degree, in the North Europe-to-East Coast South America trade.
It put Thursday’s short-term rates in this lane at $2,357 per FEU, double the average four years ago. It shows long-term rates averaging $2,622 per FEU, 2.5 times the average at this time in 2019. Long-term rates moved above short-term rates starting in January.

Meanwhile, South America’s rate resilience extends beyond the routes from Europe.
Current long-term rates from China to South America’s west coast average $3,728 per FEU, 2.4 times pre-COVID levels, according to Xeneta data.
In the U.S. market, both long- and short-term rates from the East Coast to South America’s west coast, via the Panama Canal, are still close to peak levels, averaging $2,840 and $2,734 per FEU, respectively.
Long-term rates on this route are up 77% from May 2019, short-term rates 52%, according to Xeneta data.
Different import markets, different drivers
The plunge in shipping costs for U.S. imports is being driven by high inventory overhangs due to a “bullwhip effect.” American purchases of retail goods surged during the pandemic and importers overshot when consumption fell.
COVID-era dynamics were much different in developing countries such as those in South America, where pandemic policies and consumption did not follow U.S. patterns.
Hapag-Lloyd sees the region following a long-term growth trend, citing “increasing industrialization of emerging economies” and “additional opportunities for growth in container shipping in 2023 as a result of new economic and trade agreements.”
Click for more articles by Greg Miller
Related articles:
- Container shipping under pressure as peak season hopes dim
- Shipping boom hangover: When measuring markets gets tricky
- US imports up again in April as market mirrors pre-COVID ‘normal’
- Hapag-Lloyd: Higher costs will inevitably push up shipping rates
- Maersk: Downturn on predicted course, liners acting ‘rationally’
- Trans-Atlantic shipping rates keep sinking as imports from Europe fall


