A monthly survey of activity in the supply chain published Tuesday registered an all-time low in April.
The Logistics Managers’ Index (LMI) produced a reading of 50.9 during the month, a new low for the 6.5-year-old data set. This was the third consecutive month the growth rate slowed, albeit only 20 basis points lower than the level recorded in March.
A level below 50 indicates contraction while one above signals expansion.
There was some good news in the bad news.
A big driver of the change was a 4.7-percentage-point decline in inventory levels. At 50.9, inventory levels were only slightly into growth territory, “suggesting that respondents continue to get closer to properly balancing their supply of goods and working through the glut many of them have been saddled with for the last year,” the report read.
The report also said that inventory levels may contract in May for the first time since February 2020, when the market contended with both Chinese New Year shutdowns and the outbreak of COVID. The subindex had a reading of 42.6 in the last two weeks of April compared to 63.3 in the first half of the month.
The rapid change in inventories also pulled the overall LMI into contraction territory in the back half of the month at 48.9. Normal seasonality will likely lift the index in May. However, the report cautioned that if the current inventory trends hold, the index will likely turn negative for the first time ever.
The slowing in inventory growth also pushed the subindex for inventory costs (65.1) slightly lower. While total inventory costs are continuing to grow, it is happening at a slower rate. The rate of increase for inventory costs has been steadily receding since peaking at 91 in March of last year.
The report pointed to a decline in inbound containers to the West Coast and more freight moving from east to west as indicative of “lower inventory traffic.”
Transportation data points were less bad as well.
Transportation capacity (70.6) continued to expand but the growth rate has leveled since peaking in October. Transportation utilization (55) crossed firmly into growth territory, up 5 percentage points from March and the second-highest reading since September.
“Like 2019, it seems that we simultaneously have a recession in the freight industry, but not in the overall economy. Consumer spending on things like services remains high, but bulky goods are not being shipped B2B and trucking capacity is sitting idle,” the report said.
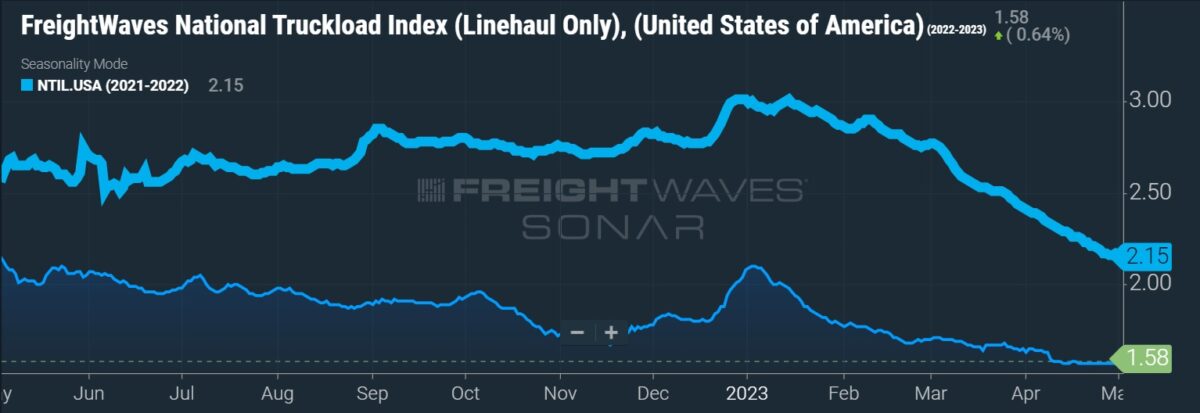
Transportation prices (36.8) remained depressed but were 5.7 points higher in the month even as fuel prices declined slightly. The subindex bounced off the all-time low set in March. When asked about transportation prices one year from now, respondents returned a reading of 48.1, indicating further declines are expected.
On the less-bad trend in transportation: “A potential explanation for this would be that as inventories continue to dip in consumer goods and retail industries (they are more stagnant Upstream for B2B goods and things like furniture or appliances that are tied to the housing market), warehousing capacity is finally loosening up, and firms are utilizing slightly more of the available transportation capacity to replenish those goods,” the report said.

Data around warehousing showed some loosening.
Warehousing capacity (54.7) was in expansion for a third consecutive month after 2.5 years of contraction. Utilization (55.1) was down nearly 10 points from March and more than 20 points lower than in September.
The combination of trends weighed on warehouse prices (69.8), which continued to see a decline in growth rates. This was the first sub-70 reading for the subindex since August 2020.
“Stagnant inventories have overloaded warehouses and left trucking fleets with nothing to do over the last year,” the report said. “If inventories continue to wind down — not just Downstream as they have been but Upstream as well — we could see the logistics industry shake itself out of some of its current doldrums.”
The LMI is a collaboration among Arizona State University, Colorado State University, Florida Atlantic, Rutgers University and the University of Nevada, Reno, conducted in conjunction with the Council of Supply Chain Management Professionals.
More FreightWaves articles by Todd Maiden
- Saia’s stock pops 15% on lone LTL earnings beat
- ArcBest defends dynamic pricing strategy
- Schneider pushes out freight recovery timetable, lowers guidance


RICHARD
Wait till the electric trucks cause inefficiencies with both drivers and equipment. I’m gonna pop a beer and laugh at the new “freight world order”. Currently the brokers and shippers are having a party…