This week’s FreightWaves Supply Chain Pricing Power Index: 40 (Shippers)
Last week’s FreightWaves Supply Chain Pricing Power Index: 40 (Shippers)
Three-month FreightWaves Supply Chain Pricing Power Index Outlook: 40 (Shippers)
The FreightWaves Supply Chain Pricing Power Index uses the analytics and data in FreightWaves SONAR to analyze the market and estimate the negotiating power for rates between shippers and carriers.
This week’s Pricing Power Index is based on the following indicators:
Significant drop in volumes thanks to the holidays
Identifying any significant changes in direction around holidays is a challenge and this year is no different. In fact, it may be more challenging to identify this year compared with any recent year as both the Christmas and New Year’s holidays fall on a Wednesday, which creates increased operational challenges for shippers.

To learn more about SONAR, click here.
The Outbound Tender Volume Index (OTVI), a measure of national freight demand that tracks shippers’ requests for trucking capacity, is down over 31% in the past week, but the index is a seven-day moving average and holidays effectively create zero days in the moving average. The decline this year was more significant than it has been in recent years, but that is likely more a result of timing of the holidays than a fundamental shift in volumes.
After the first week of January, the direction in which volumes are headed will be clearer. The challenge for the market is that the first two months of the year are traditionally the softest periods for freight, and there is nothing to suggest that there will be stronger volumes during this time.

To learn more about SONAR, click here.
Contract Load Accepted Volume (CLAV) is an index that measures accepted load volumes moving under contracted agreements. In short, it is similar to OTVI but without the rejected tenders. Looking at accepted tender volumes, the decline is similar to OTVI, falling by over 31% in the past week.

To learn more about SONAR, click here.
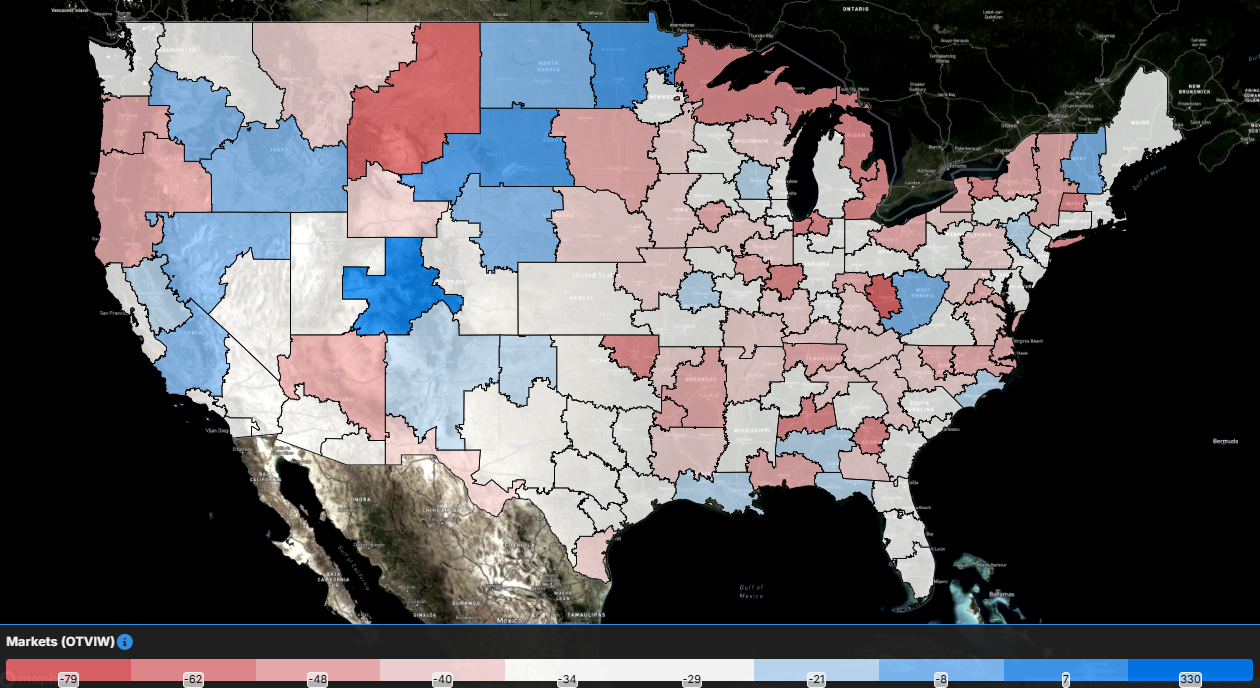
As expected when there is a significant decline in tender volumes at the national level, nearly all of the freight market experienced declines. Of the 135 freight markets, just four of the markets experienced volume growth, though the increases are solely in more rural freight markets.
In a positive sign for the freight market, volumes out of Los Angeles outperformed the national average, falling by 29%. It’s the same story in Atlanta, where volumes fell by 29% over the past week.
The only four markets that experienced increases were: Grand Junction, Colorado; Fargo, North Dakota; Rapid City, South Dakota; and Bristol, New Hampshire. The increases varied from 1% higher to 330% higher w/w.

To learn more about SONAR, click here.
By mode: The dry van market experienced a more significant decline than the overall market. The Van Outbound Tender Volume Index fell by 34% over the past week. Van outbound volumes are down 10.65% over the past year.
The reefer market remains the outperformer between the two equipment types. The Reefer Outbound Tender Volume Index fell by 21.2% over the past week. Compared to this time last year, reefer tender volumes are up 3.4%.
Tender rejection rates break above 10%, briefly
It finally happened! Tender rejection rates broke above 10% for the first time in more than two years, but it was just a brief stint above the double-digit threshold. Tender rejection rates have retreated from above 10%, though they are still higher than they were this time last week. Rejection rates will retreat after the holidays as capacity returns to the road, but the question that remains is how low they will fall in January and February.

To learn more about SONAR, click here.
Over the past week, the Outbound Tender Reject Index (OTRI), a measure of relative capacity, rose by 35 basis points to 9.69%. The OTRI is 418 basis points higher than it was this time last year, a sign that the market is tighter now than it was then. The spike, while not as extreme as 2019, does represent a more responsive market than the previous two holiday seasons.

To learn more about SONAR, click here.
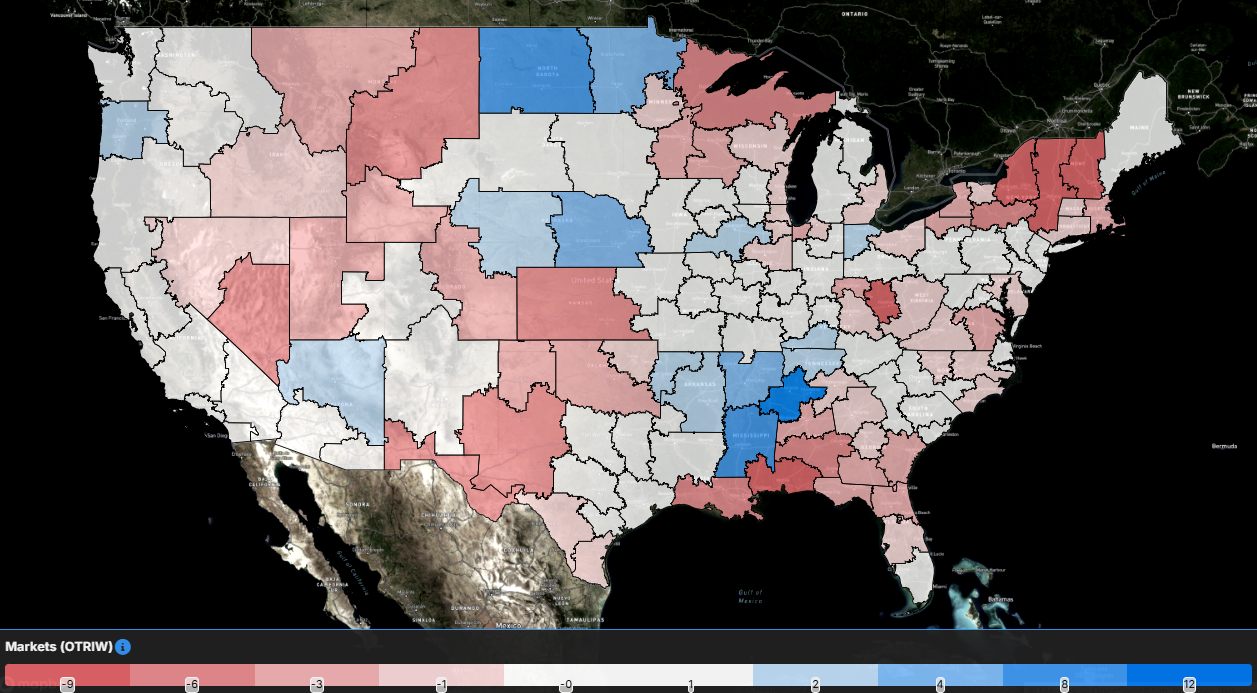
The map above shows the Outbound Tender Reject Index — Weekly Change for the 135 markets across the country. Markets shaded in blue and white are those where tender rejection rates have increased over the past week, whereas those in red have seen rejection rates decline. The bolder the color, the more significant the change.
Of the 135 markets, 67 reported higher rejection rates over the past week, down from the 121 that saw tender rejection rates rise in last week’s report.
Surprisingly enough, even with tender rejection rates increasing at the national level over the past week, the split between the number of markets that experienced higher rejection rates and the number that had lower rejection rates was dead even. Tender rejection rates in the largest market in the country, Ontario, California, continued to rise over the past week, up by 165 basis points to 9.34%, nearly three times higher than it was this time last year. The Chicago market saw tender rejection rates retreat this week after breaking above 10% last week, falling 123 bps to 9.44%. The largest increases in the country were primarily isolated to smaller freight markets, though the Memphis, Tennessee, market experienced a sizable increase: Tender rejection rates increased by 630 bps w/w to 17.95%.

To learn more about SONAR, click here.
By mode: The dry van market continues to see tender rejection rates rise, approaching 10%. Over the past week, the Van Outbound Tender Reject Index increased by 41 basis points to 8.71%. Van tender rejection rates are 357 basis points higher than they were this time last year.
The reefer market remains the tightest equipment type by far, though rejection rates have retreated from their recent highs. The Reefer Outbound Tender Reject Index fell by 265 basis points over the past week to 18.59%. Reefer rejection rates are more than double where they were this time last year, up 950 bps.
Flatbed tender rejection rates experienced the largest increase of the equipment types over the past week. The Flatbed Outbound Tender Reject Index rose 360 basis points to 17.36%. Compared to this time last year, flatbed tender rejection rates are down 67 bps.
Spot rates remain above Thanksgiving levels
Spot rates haven’t touched the highs set a couple of weeks ago, but they haven’t declined significantly. The growth in spot rates over the past two months shows that carriers have been able to capture some pricing power back. The luxury for carriers is that if spot rates continue to rise into 2025, it creates a higher floor for rates heading into the new year.

To learn more about SONAR, click here.
The National Truckload Index – which includes fuel surcharge and various accessorials – rebounded, rising by 3 cents per mile to $2.46. The NTI is 10 cents per mile higher than it was this time last year, but given the move rejection rates made over the past week, it is likely the gap will widen during the next week. The linehaul variant of the NTI (NTIL) – which excludes fuel surcharges and other accessorials – experienced a slightly smaller increase than the overall NTI, rising 2 cents per mile to $1.91. The NTIL is 18 cents per mile higher than it was this time last year, showing how the underlying rate has moved over the past year.
Initially reported dry van contract rates, which exclude fuel, fell off their recent Thanksgiving high, returning to the range they have been in for much of the year. The initially reported dry van contract rate, excluding fuel, was unchanged over the past week at $2.34. Contract rates are 5 cents per mile higher than they were this time last year. With the responsiveness in rejection rates and spot rates, contract rates will likely increase in 2025.

To learn more about SONAR, click here.
The chart above shows the spread between the NTIL and dry van contract rates is trending back to pre-pandemic levels. The spread remains wide, but with the recent pullback by spot rates of the highs and contract rates remaining fairly stable, the spread narrowed by 14 cents over the past week to 37 cents, the narrowest it has been in multiple years. Compared to this time last year, the spread between spot and contract rates is 26 cents narrower.

To learn more about SONAR, click here.
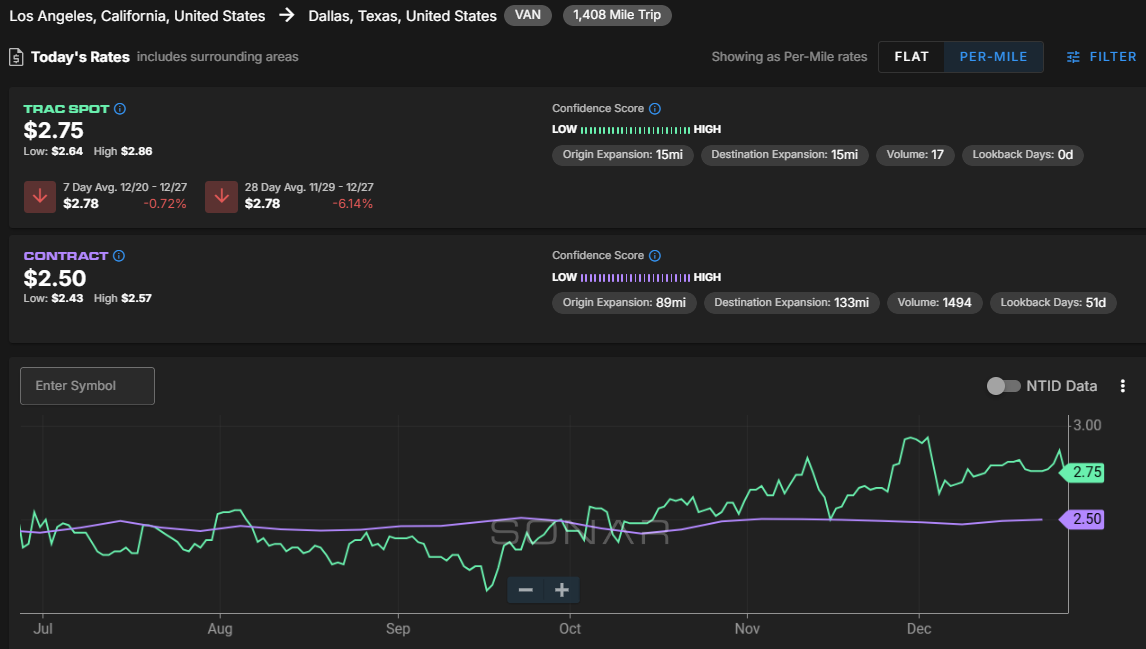
The SONAR Trusted Rate Assessment Consortium spot rate from Los Angeles to Dallas continued its increase this week. The TRAC rate from Los Angeles to Dallas decreased by 2 cents per mile to $2.75. Spot rates along this lane are 25 cents per mile above the contract at present, which is why rejection rates out of Los Angeles are on the rise, now above 9%.

To learn more about SONAR, click here.
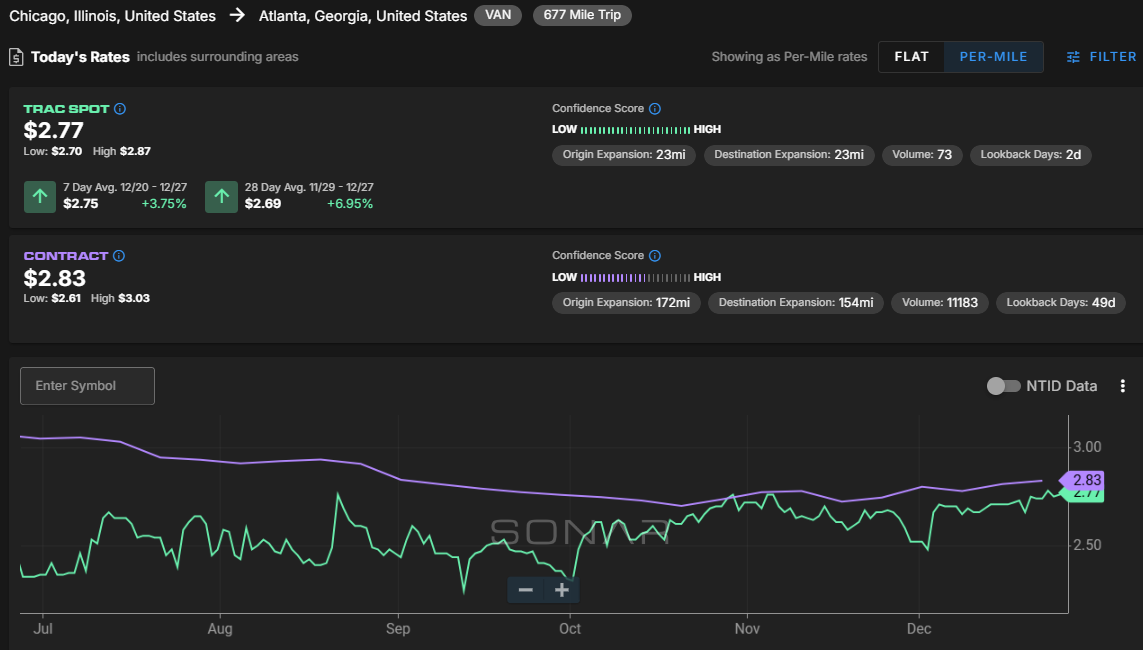
From Chicago to Atlanta, spot rates have been volatile, but they really haven’t moved significantly since the beginning of November. The TRAC rate for this lane increased over the past week by 10 cents per mile to $2.77. Spot rates are 6 cents per mile below the contract rate, but that spread is at a level at which spot rates offer optionality for carriers and can make the market feel tighter for shippers than it was just a few months ago when the spread was in the 40-cent range.


