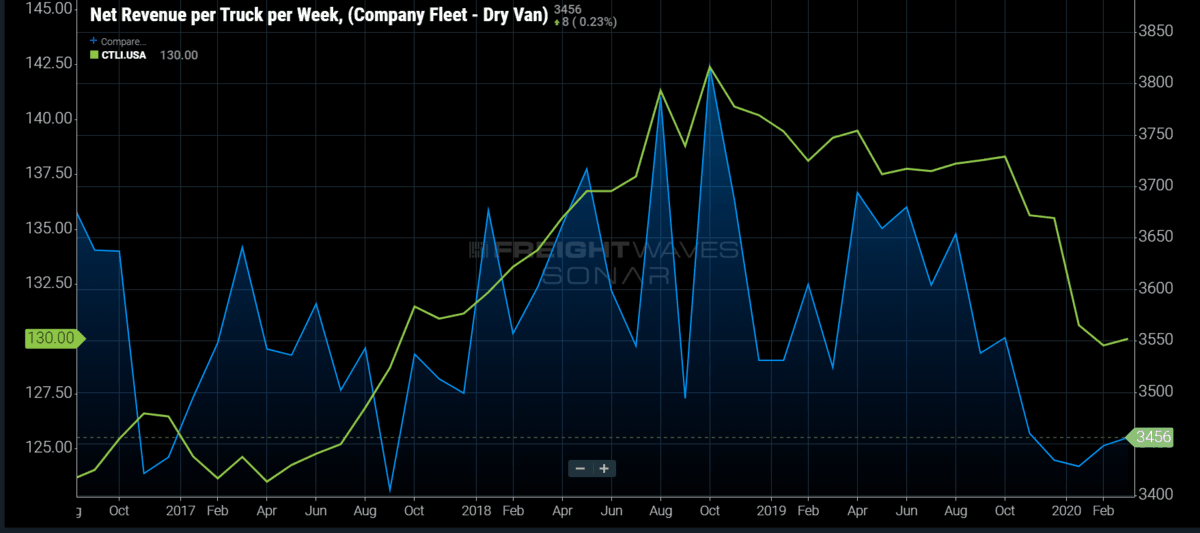
Chart of the Week: Net Revenue per Truck per Week – Dry Van, Cass Truckload Linehaul Index – USA SONAR: NETREV.VCF, CTLI.USA
A few 1Q earnings reports for publicly traded carriers came out over the past two weeks with most of them reporting reduced profitability. Mega carrier Knight-Swift was an exception to this reporting lower truckload revenue and a slightly improved operating ratio. J.B. Hunt and Heartland both reported higher operating ratios (lower profit margin) for their truckload segments on increased revenue. Buried in all the concern over COVID-19 is the fact carrier numbers were probably going to look much worse without the surging demand resulting from the outbreak.
Looking at the Cass Truckload Linehaul Index and the Truckload Carrier’s Association (TCA) net revenue per truck per week metric, there is a noticeable decline starting towards the end of last year. Both showed a slight sequential uptick in March this year, indicating a slight increase in rates.
The Cass Linehaul Index measures transportation cost less fuel and accessorial charges, essentially the base cost of moving truckload freight. The index peaked in October of 2018 when the freight market experienced some of the strongest demand in the past decade after having a slower 2016-2017. Carriers implemented multiple rate increases during the year to account for the increased demand. A byproduct of such fruitful times, however, was the subsequent oversupply of capacity that resulted in 2019.
From October of 2018 to December of 2019 the Cass Truckload Linehaul Index fell about 4.9%. The decline from December 2019 to February of this year was almost as much in a fraction of the time, falling 4.29%.
A big reason for declining truckload cost from December to February was not driven by the spot market, which is estimated to account for roughly 10-20% of the for-hire market at any given time, but the decrease in contracted rates.
In a softening market, contracted freight gains a larger market share as carrier acceptances of load tenders from their contracted shippers increase. FreightWaves Outbound Tender Rejection Index averaged near 20% in 2018 but fell to an average of 6.07% in 2019. The decline in rejection rate is indicative of increasing carrier availability, making the spot market less necessary for locating capacity.

Carriers were able to enjoy inflated rates through most of 2019 due to the contracts implemented from 2018. Most shippers run an annual bid with many of those bids becoming active at the start of the new year and lasting for at least 12 months.
The large drop in the Cass index at the beginning of 2020 was reflective of a competitive 2019 bid season with carriers clawing back some of the increases gained from 2019 in order to maintain their position on shipper routing guides — the list of carriers sorted from highest to lowest preference in each lane.
These routing guides are made based on a combination of price, service, and reliability. In order to maintain their competitive position, they had to pull back on some of their rate increases from 2018.
In March, however, tender rejection rates soared back above 19% in a matter of weeks before falling rapidly at the end of the month. Spot rates jumped 20% from March 2 to March 25 according to the national DAT Longhaul Van Freight Rate, used for the settlement of freight futures. Many carriers were able to take advantage of this temporary increase in rate outside of the contracted arena.
Unfortunately for the carriers, this was a short-lived event with tender rejection rates falling throughout April to record lows, under 3% for the first time since the index’s inception in early 2018. Spot rates followed suit, falling from an average of $1.58/mile excluding fuel to $1.20 by April 17.
For many carriers, March’s heated market will only be a slight boost in what appears to be a dismal first half of 2020. Volumes appear to have bottomed for the moment, but still 12% under previous year. The second quarter earnings calls will more than likely be more reflective of what many expect from the impact of COVID-19.
About the Chart of the Week
The FreightWaves Chart of the Week is a chart selection from SONAR that provides an interesting data point to describe the state of the freight markets. A chart is chosen from thousands of potential charts on SONAR to help participants visualize the freight market in real time. Each week a Market Expert will post a chart, along with commentary, live on the front page. After that, the Chart of the Week will be archived on FreightWaves.com for future reference.
SONAR aggregates data from hundreds of sources, presenting the data in charts and maps and providing commentary on what freight market experts want to know about the industry in real time.
The FreightWaves data science and product teams are releasing new data sets each week and enhancing the client experience.
To request a SONAR demo, click here.


