This week’s FreightWaves Supply Chain Pricing Power Index: 35 (Shippers)
Last week’s FreightWaves Supply Chain Pricing Power Index: 35 (Shippers)
Three-month FreightWaves Supply Chain Pricing Power Index Outlook: 40 (Shippers)
The FreightWaves Supply Chain Pricing Power Index uses the analytics and data in FreightWaves SONAR to analyze the market and estimate the negotiating power for rates between shippers and carriers.
This week’s Pricing Power Index is based on the following indicators:
Volumes rebound but still down year over year
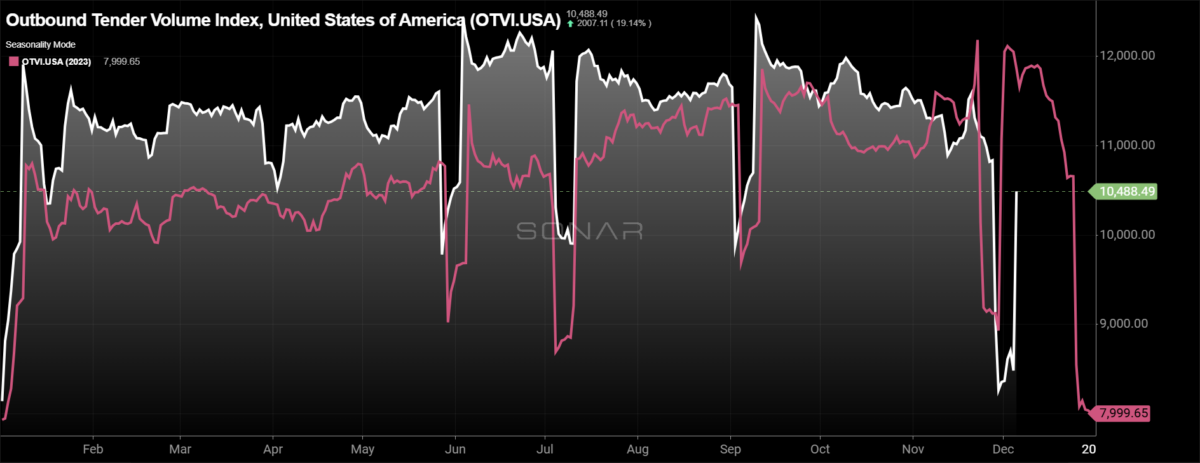
True to form, tender volumes bounced back from the Thanksgiving holiday, but volumes remain depressed compared to last year. December is traditionally the softest month of the year due to the holidays in the back half of the month, and slowing business conditions create a challenging environment. There are just two weeks until the holidays, so at this time a significant uptick in volumes before the end of the year seems unlikely.
To learn more about SONAR, click here.
The Outbound Tender Volume Index (OTVI), a measure of national freight demand that tracks shippers’ requests for trucking capacity, rebounded from last week, rising 16.28%, but that growth is tied solely to the holiday. When holidays impact the freight market, it is more beneficial to compare the two-week change in freight volumes. On a two-week stack, the OTVI is down 7.3%. Compared to this time last year, tender volumes are down 11%, but some of that is the full impact of the Thanksgiving holiday weekend not being erased from this year.
Across the mileage band, midhaul volumes, loads moving between 250 and 400 miles, held up better than other volumes over the past two weeks, falling just 3.04%.
To learn more about SONAR, click here.
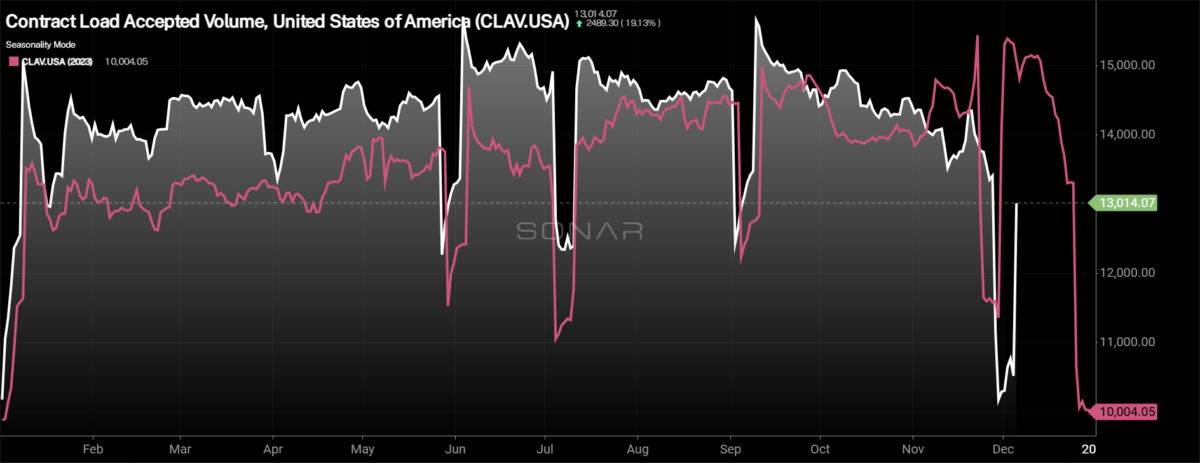
Contract Load Accepted Volume (CLAV) is an index that measures accepted load volumes moving under contracted agreements. In short, it is similar to OTVI but without the rejected tenders. Looking at accepted tender volumes, the rebound was greater w/w due to lower tender rejection rates, rising 16.7%. Compared to two weeks ago, CLAV is down 7.17%, and it’s down 13.2% y/y.
It appears as if retailers were ready to handle the influx of demand from consumers during the retail holiday that is the five days from Thanksgiving through Cyber Monday. Adobe Analytics showed that on Cyber Monday alone, consumers spent $13.3 billion, a 7.3% increase y/y.
To learn more about SONAR, click here.
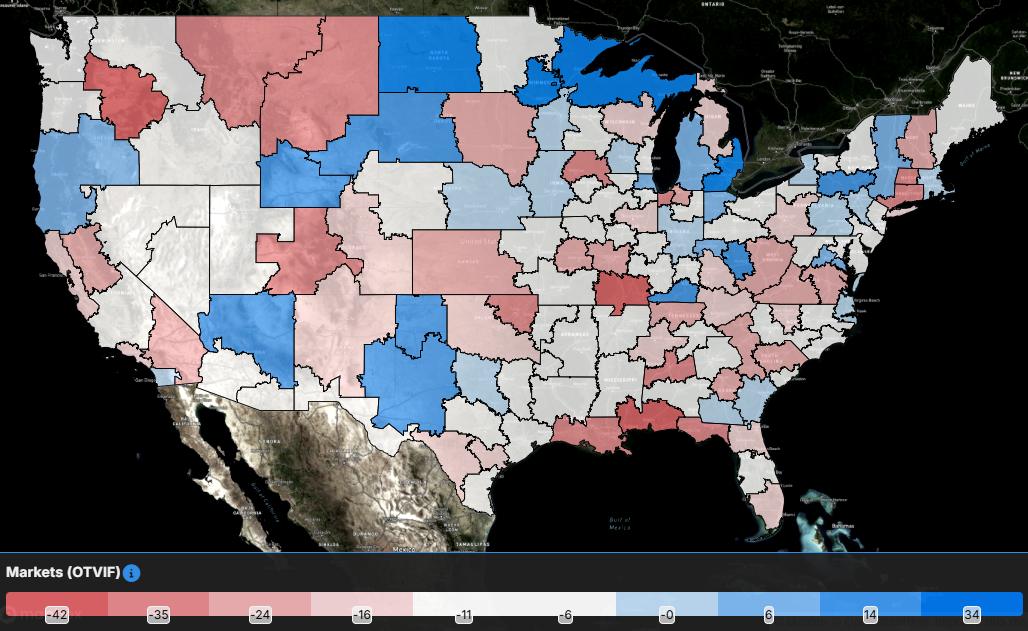
As would be expected coming out of the holiday, tender volumes across the country are largely higher week over week. Of the 135 freight markets tracked within SONAR, 111 have seen tender volumes increase over the past week. On a two-week stack, just 30 of the freight markets tracked within SONAR experienced higher volumes.
Tender volumes out of the Chicago market have experienced momentum the past two weeks, rising by 9.76%, by far the largest increase of the largest freight markets in the country.
Tender volumes out of Southern California are significantly challenged but are starting to recover from the holiday. Tender volumes out of Ontario, California, are down over 20% from two weeks ago, but that is still a result of the Thanksgiving holiday.
To learn more about SONAR, click here.
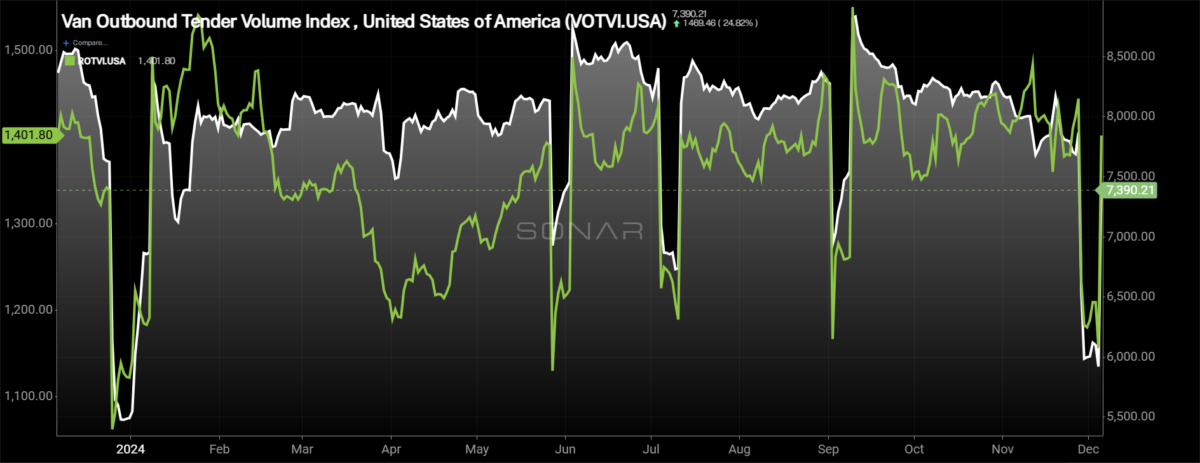
By mode: The dry van market has been in continuous decline since the beginning of September and kept declining the past two weeks. The Van Outbound Tender Volume Index is up 13% w/w, due to the holiday but is down 5.92% on a two-week stack. Compared to this time last year, dry van volumes are down 12.5%, but again these comparisons are impacted by holidays.
The reefer market hasn’t experienced a decline similar to that of the dry van market, but it has faced volatility on a week-to-week basis over the past several months. The Reefer Outbound Tender Volume Index is down just 0.4% over the past two weeks. Reefer volumes are down just 1.6% compared to this time last year and will likely turn positive as the Thanksgiving holiday impacts continue to roll off the index.
Rejection rates retreat from holiday highs
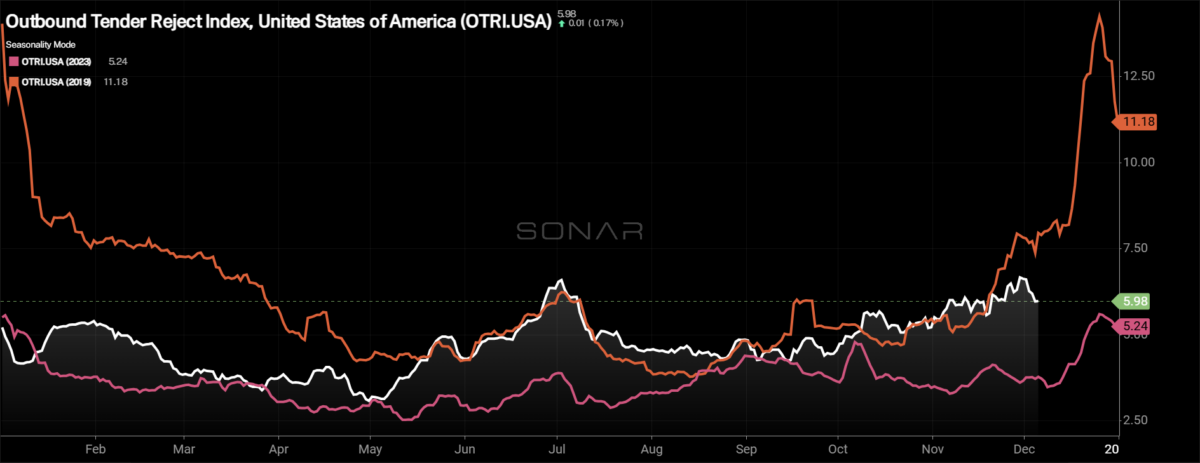
After setting a year-to-date high last week, tender rejection rates have dipped below 6% once again. After following the 2019 trend line fairly closely, the market hasn’t experienced a breakout like it did in 2019, but there are still positive signals heading into the final weeks of the year. The largest positive signal is that tender rejection rates have been steadily trending higher since mid-September without significant spikes on the climb, signaling a more sustainable increase as opposed to just holiday impacts.
To learn more about SONAR, click here.
Over the past week, the Outbound Tender Reject Index (OTRI), a measure of relative capacity, fell by 33 basis points to 5.98%. The OTRI is 230 bps higher than it was this time last year, showing that capacity has been exiting the market and carriers have slightly more optionality in the market than they did this time last year. With just two weeks until the holidays are in full swing, and with the OTRI not retreating significantly, rejection rates hitting double digits before the end of the year remains a strong possibility but maybe not to the extent of 2019.
To learn more about SONAR, click here.
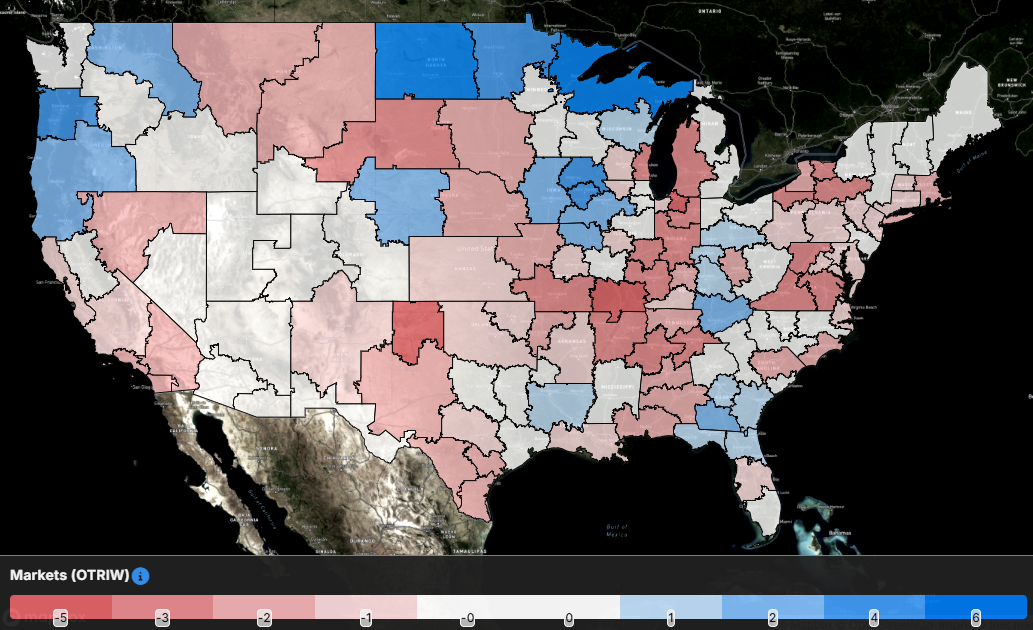
The map above shows the Outbound Tender Reject Index — Weekly Change for the 135 markets across the country. Markets shaded in blue and white are those where tender rejection rates have increased over the past week, whereas those in red have seen rejection rates decline. The bolder the color, the more significant the change.
Of the 135 markets, 50 reported higher rejection rates over the past week, down from the 75 that saw tender rejection rates rise in the report before Thanksgiving.
With tender volumes rising in Chicago, tender rejection rates also moved higher over the past week. Tender rejection rates in Chicago increased by 48 basis points to 6.68%.
In Ontario, tender rejection rates fell by 150 basis points over the past week to 4.45%, the lowest level since the beginning of the year.
To learn more about SONAR, click here.
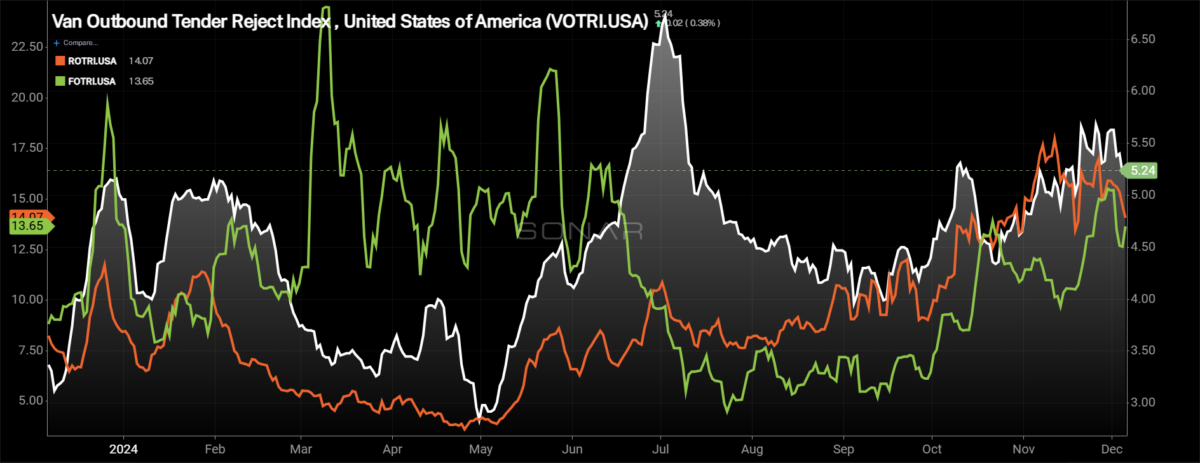
By mode: The dry van market has seen tender rejection rates trend higher, but they didn’t approach the year-to-date high set around the Fourth of July holiday. The Van Outbound Tender Reject Index fell by 9 basis points over the past week to 5.24%. Despite the slight decrease, van tender rejection rates are 193 bps higher than they were this time last year.
The reefer market experienced a fairly decent drop in rejection rates over the past week, but rates remain significantly higher than they were this time last year. The Reefer Outbound Tender Reject Index fell by 33 basis points to 14.07%. Compared to this time last year, reefer rejection rates are up 644 bps.
The flatbed market remains quite volatile, especially after suffering a lull during late July through the beginning of October. The Flatbed Outbound Tender Reject Index fell by 135 basis points over the past week to 13.65%, but that is still at levels not experienced since the middle of June. Flatbed tender rejection rates are 442 basis points higher than they were this time last year.
Spot rates fall but remain elevated compared to much of the year
Tender rejection rates have retreated as capacity came back online, and as a result spot rates have given up some of their recent gains. Even so, spot rates remain elevated compared to where they were this time last year and higher than they have been throughout much of the year, allowing for a higher baseline for carriers heading into the final weeks of the year.
To learn more about SONAR, click here.
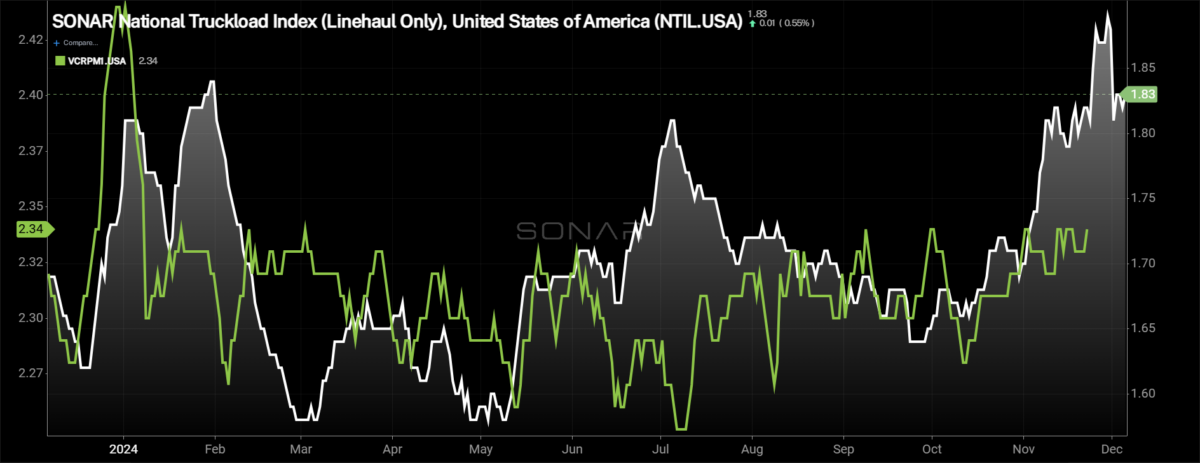
This week, the National Truckload Index – which includes fuel surcharge and various accessorials – retreated from the recent highs, falling by 5 cents per mile over the past week to $2.38. The NTI is now 4 cents per mile higher than it was this time last year. The linehaul variant of the NTI (NTIL) – which excludes fuel surcharges and other accessorials – decreased by 4 cents per mile over the past week, a sign that the decline wasn’t impacted only by falling linehaul rates but also to some degree by falling diesel prices. The NTIL currently sits at $1.83 per mile, the highest level of the past year outside of last week’s Thanksgiving-related increase and exceeding the Fourth of July peak. The NTIL is 14 cents per mile higher than it was this time last year, a sign of how impactful the decline in diesel fuel prices has been as a deflator for all-in spot rates. The average diesel price at truck stops is down 15.1% compared to this time last year.
Initially reported dry van contract rates, which exclude fuel, have remained fairly stable the past couple of months, as shippers have become more understanding over the past year that pricing could shift significantly. Over the past week, the initially reported dry van contract rate was unchanged at $2.33. Initially reported dry van contract rates are 2 cents per mile lower than they were this time last year.
To learn more about SONAR, click here.
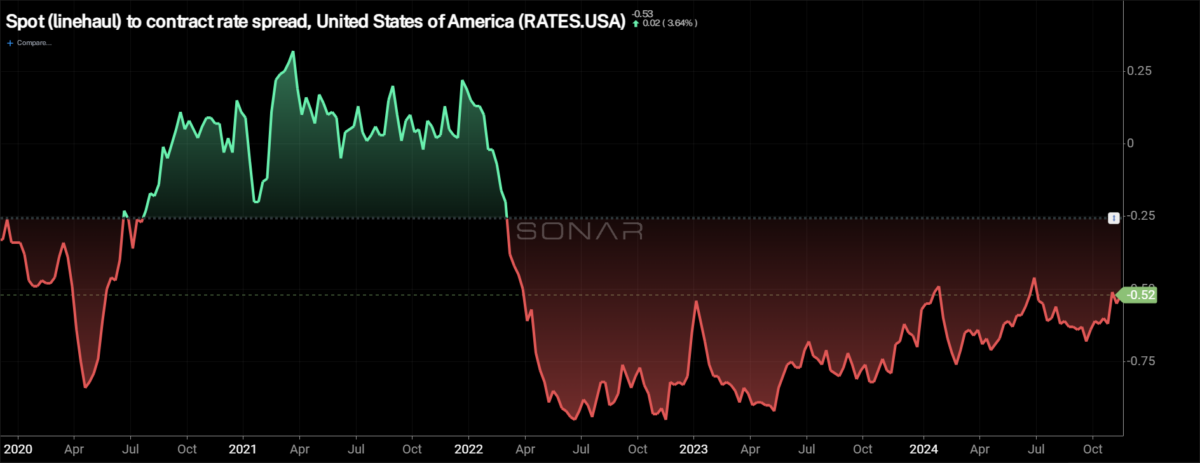
The chart above shows the spread between the NTIL and dry van contract rates is trending back to pre-pandemic levels. The spread remains wide, but with the recent positive momentum in spot rates and flattening of contract rates, the spread is narrowing over the long term. Over the past week, the spread between contract and spot rates narrowed by 1 cent per mile, and it is 23 cents narrower than it was this time last year.
To learn more about SONAR, click here.
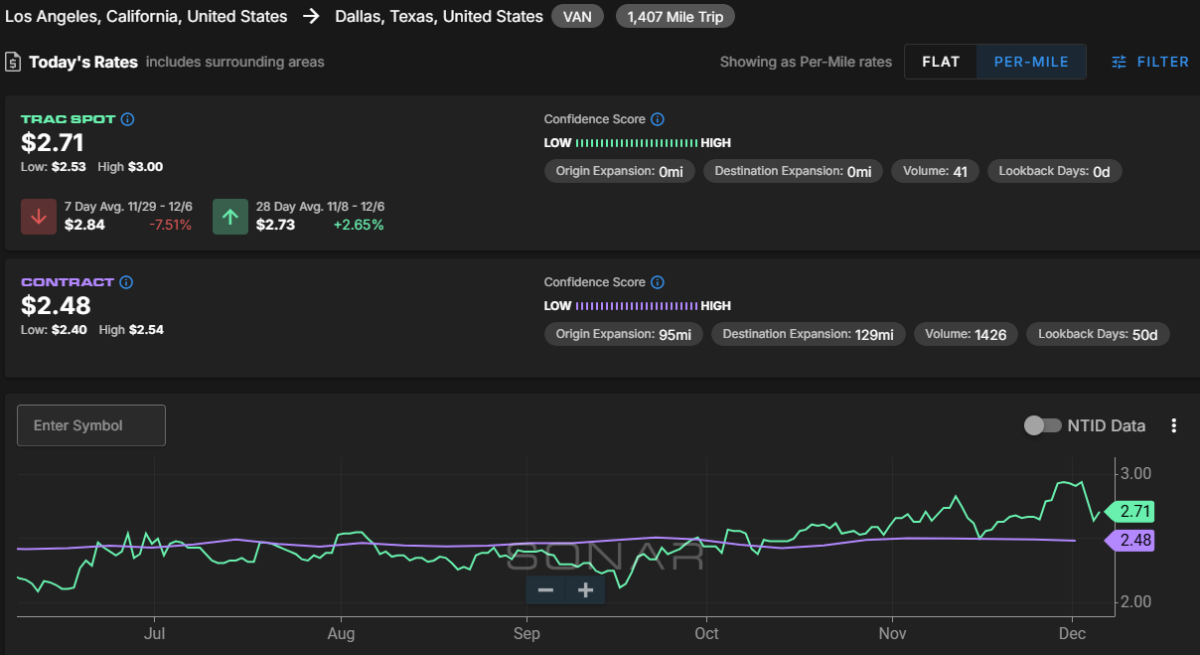
The SONAR Trusted Rate Assessment Consortium spot rate from Los Angeles to Dallas continues to trend higher but not without some volatility along the way. The TRAC rate from Los Angeles to Dallas decreased by 22 cents per mile to $2.71, which is actually 3 cents per mile higher than it was two weeks ago. Spot rates along this lane are 23 cents per mile above the contract at present.
To learn more about SONAR, click here.
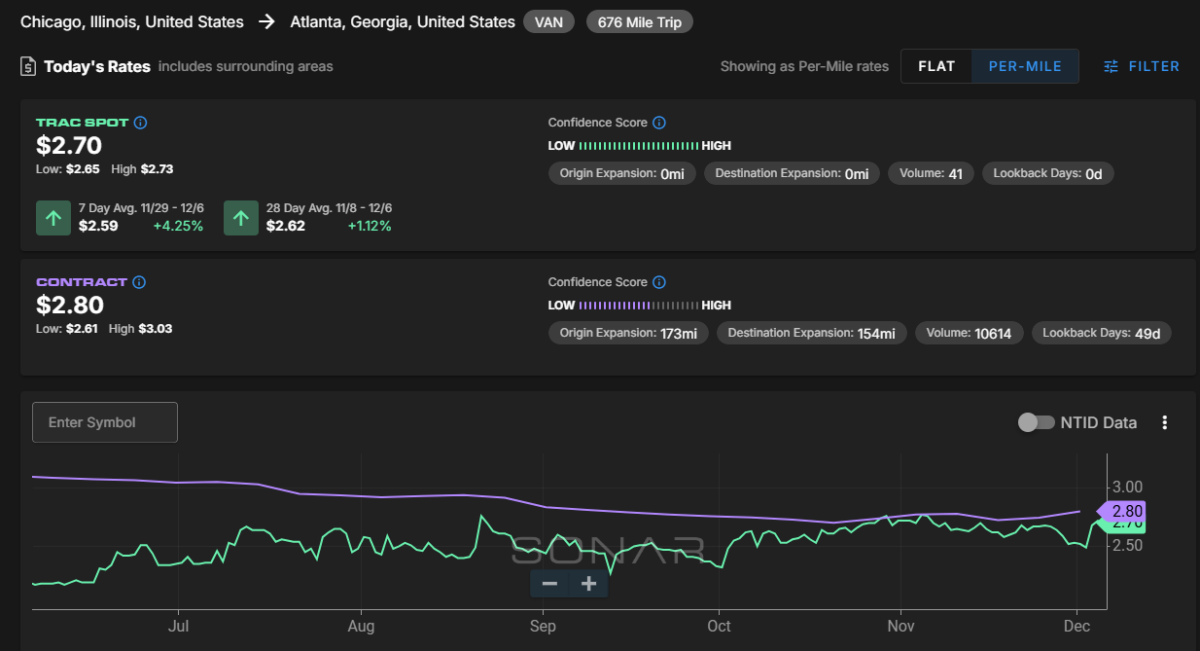
From Chicago to Atlanta, spot rates have been volatile but really haven’t moved significantly since the beginning of November. The TRAC rate for this lane increased over the past week, rising by 11 cents per mile to $2.70. Spot rates are 10 cents per mile below the contract rate, but that spread is at a level where spot rates offer optionality for carriers.


