Each piece of the supply chain — manufacturing, transportation and consumption — depends on one thing: people.
The imbalance of the supply chain now is based on human error — the over-ordering of products and selling those that people didn’t want — and port congestion — caused by fears of an International Longshore and Warehouse Union (ILWU) strike, which has diverted trade and created bottlenecks. We know trade is slowing down, but the congestion skews the reality of the pullback in orders.
Trade data is actionable. It provides insight into retail expectations. We know orders have been down, and as a result, we have seen freight rates fall and blank sailings increase.
But how big is that hole in the consumer bucket?
Data from the CNBC Supply Chain Heat Map shows a 20-30% drop in ocean bookings in September and October. The product range is wide, from apparel to home products. But even among the softness, there is strength in orders of higher-end items like ultrasound machines and time-sensitive promotional signs.
The decrease in ocean bookings falls in line with a prediction from the Georgia Ports Authority, which said it expects the number of vessels at anchor to dwindle over the next several weeks. Meanwhile, the supply chain heat map still shows vessel congestion on the East Coast and in the Gulf.

To put a floor on the plunging ocean freight prices, ocean carriers are positioning tactical blank sailings to match the vessel space with the orders they are receiving. In its recent transpacific report, cargo tracker Honour Lane Shipping noted vessel capacity cuts are down by nearly 50%. This pullback may continue into 2023 until the demands pick up before Chinese New Year.
“On the transpacific, capacity reductions are slated to be 22-28% of deployed weekly capacity in the weeks following [China’s] Golden Week, whereas the peak reduction in those weeks was 15-17% in 2019 and an average of 9-11% in 2014-2018,” Sea-Intelligence CEO Alan Murphy said. “We see higher numbers in Asia-North Europe, as well, with the peak capacity reduction following Golden Week at a little under 20%, which, while in line with 2019, is higher than the 2014-2018 average. Asia-Mediterranean, on the other hand, is the only trade lane of the four to see capacity reduction during Golden Week 2022, in line with 2014-2019.”
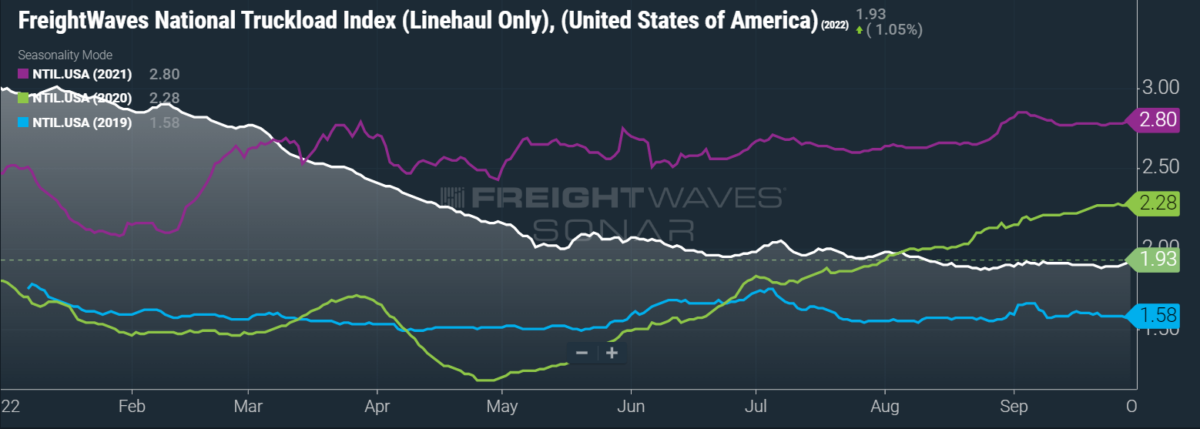
Over the road, FreightWaves SONAR is tracking spot rates 31% below where per-mile spot rates, excluding fuel, were at last year.

The one thing trade can’t control
Ironically, the Achilles’ heel of trade is people.
This year will go down as the year of labor. Those who are responsible for the movement of trade know their worth and will do whatever it takes to be heard.
The labor strikes in Europe have slowed down the supply chain out of Germany until the first quarter. The U.K. union worker has the supply chain at their mercy. As a result, the Europe Supply Chain Heat map is just ugly, and logistics managers are navigating the limited options.
“For OL UK, we are treating each [bill of lading] with new eyes, as each client has different needs and wants,” said Paula Bellamy, managing director of OL UK. “And it’s our role to advise them on a daily basis on what the situation is, what the additional cost implication would be, and together to make a decision that suits our client. Europe waiting times at the likes of Hamburg and Bremerhaven are well above their annual average, and this solution also comes with Brexit challenges if the containers remain destined for the U.K.”
According to Andreas Braun, Europe, Middle East and Africa ocean product director of Crane Worldwide Logistics: “While we see slight overall improvements in terms of waiting times for vessels in Hamburg and Bremerhaven [and] a downtrend in yard occupancy in Antwerp and Rotterdam, the overall situation in the U.K. is getting worse due to the strikes. Vessel delays and omittance are increasing quickly. The container availability and trucking situation is worsening, and the other terminals, like London or Southampton, cannot accommodate any more overflow cargo from the striking ports.”
With another strike set for Liverpool and the ILWU negotiations continuing, the one thing you can bank on is the uncertainty of the human element of trade.
The CNBC Supply Chain Heat Map data providers are artificial intelligence and predictive analytics company Everstream Analytics; global freight booking platform Freightos, creator of the Freightos Baltic Dry Index; logistics provider OL USA; supply chain intelligence platform FreightWaves; supply chain platform Blume Global; third-party logistics provider Orient Star Group; marine analytics firm MarineTraffic; maritime visibility data company project44; maritime transport data company MDS Transmodal UK; ocean and air freight rate benchmarking and market analytics platform Xeneta; leading provider of research and analysis Sea-Intelligence ApS; Crane Worldwide Logistics; DHL Global Forwarding; freight logistics provider Seko Logistics; and Planet, provider of global, daily satellite imagery and geospatial solutions.


