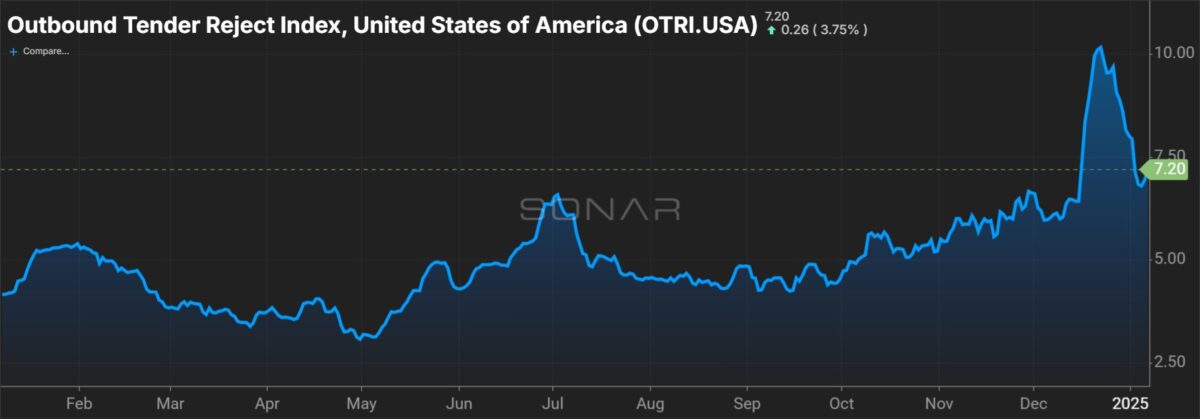
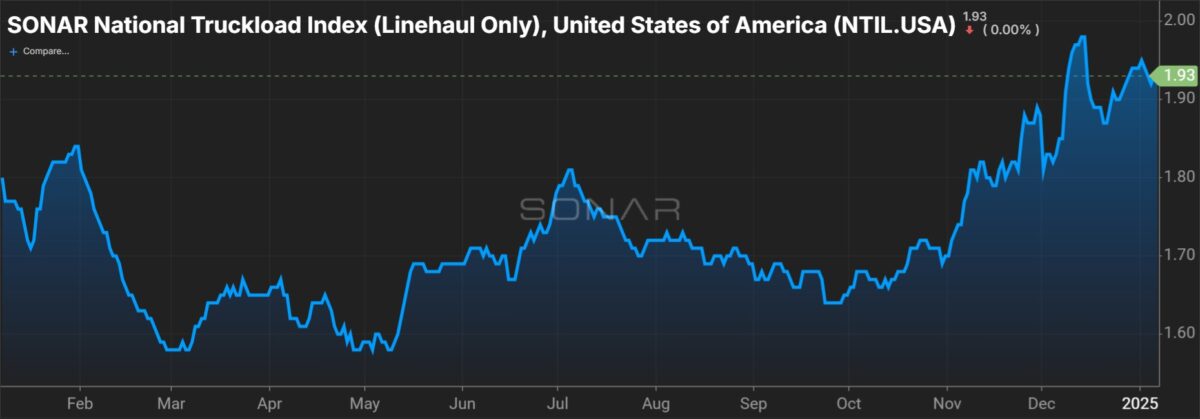
The growth rate of transportation prices surged to a more than two-year high in December, according to a monthly survey of supply chain managers.
The Logistics Managers’ Index showed sentiment around transportation prices stood at 66.8 during the recent month, up 3 percentage points from November and the highest growth rate posted since April 2022. Strong consumer demand and record e-commerce deliveries were cited as the reasons for the acceleration in the pricing index.
The LMI is a diffusion index wherein a reading above 50 indicates expansion while one below 50 signals contraction.
Transportation capacity (53.2) increased 60 basis points from November, remaining modestly in growth territory. This was a third straight month of expansion. The subindex twice hit cycle lows of 50 during 2024. Transportation utilization remained at 60.5 during December.
The pricing dataset is 13.6 points higher than the capacity subindex – the “highest positive delta in favor of prices” since April 2022.
“Available Transportation Capacity has not contracted since March of 2022 when the freight recession of 2022-2024 began,” a Tuesday report said. “This is a testament to the high levels of capacity that were built from 2020-2021.”
The 12-month outlook for capacity was neutral at 50. However, supply chain managers are bracing for higher rates. Their collective forward-looking expectation for pricing came in at 77 during the month.


The overall LMI fell 1.1 points from November, to 57.3. A seasonal drawdown in inventories and an accompanying deceleration in the growth of inventory costs were the primary reasons for the move in the index.
Inventory levels (50) were down 6.1 points sequentially to a neutral level.
Inventories grew at wholesalers and manufacturers, or companies that are upstream in the supply chain. A 57.9 reading for the group was attributed to a surge in container imports as some companies took delivery of goods ahead of potential changes in tariff policy.
Downstream companies like retailers saw inventories contract, posting a reading of 33.9. Retailers typically burn through merchandise in the holiday season.
“Retailers were clearly correct in their bet to stock on goods ahead of the holiday season,” the report said, pointing to a 3.8% increase in holiday sales this year. “By bringing inventories forward now, retailers hope to avoid putting any increased costs stemming from potential tariffs on consumers that are already tired from the inflation of 2021-2022.”
Upstream and downstream companies expect inventories to be higher one year from now with both returning near-70 forward-looking expectations.
“These numbers both represent significant rates of expansion and would be a major departure for the leaner inventory policies that categorized 2023 and 2024,” the report said.
Inventory costs (61.6) grew at a slower rate in the month, down 7.1 points from November. This was mostly due to the slowing in inventory deliveries. Inventory costs were nearly 10 points higher in the second half of December.
Warehouse capacity (56.9) was up 20 bps, with slower growth upstream (53.5) than downstream (63.3). Looking out 12 months, upstream companies (52.1) expect the real estate market to be balanced while downstream operators (71.7) see significant capacity expansion.
Warehouse utilization (61.7) was up 2.8 points while prices (68) dipped 80 bps. Growth in warehouse pricing was nearly 9 points higher in the first half of the month.
The LMI is a collaboration among Arizona State University, Colorado State University, Florida Atlantic University, Rutgers University and the University of Nevada, Reno, conducted in conjunction with the Council of Supply Chain Management Professionals.


