FreightWaves’ SONAR chart of the week (June 30, 2019 – July 6, 2019)
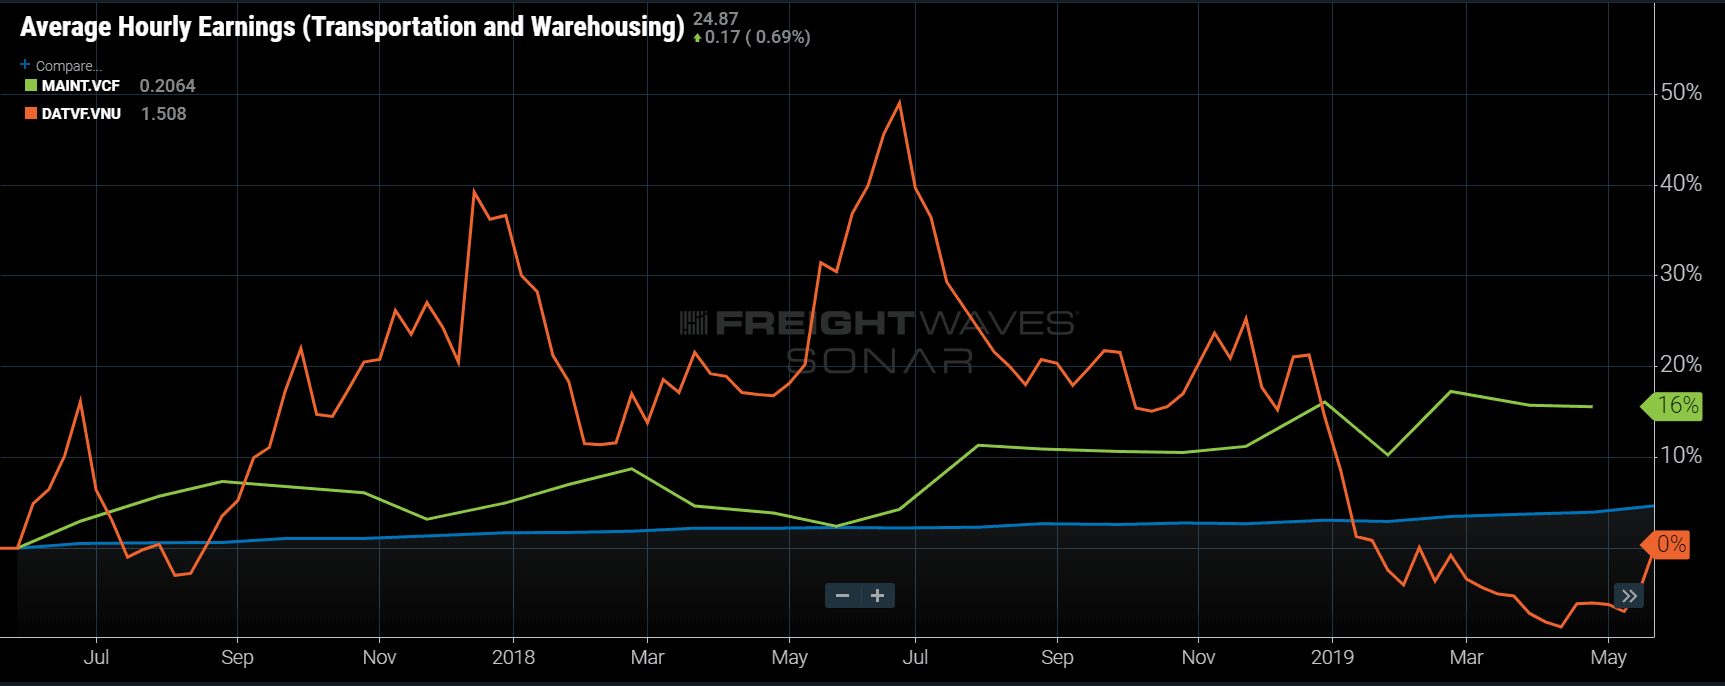
Chart of the Week: Average hourly wages – Transportation and Warehousing, Maintenance cost per mile, DAT Van Freight Rate Index – National (SONAR: EARN.TPWH, MAINT.VCF, DATVF.VNU )
The longest freight market bull-run in over a decade is over as spot rates have fallen back to where they were two years ago. The problem presented to many carriers is that many of their costs have not. In this week’s chart, comparing wage and maintenance costs to average daily national spot rate over the last two years, spot rates have fallen back to under June 2017 levels while costs have continued to grow on a more even keel.
Spot rates are not a one to one relationship with carrier revenues, but they do offer insight into general direction. The longer spot rates remain elevated the likelihood carrier revenues will follow increases and vice versa. The reason this happens is market pressure. If carriers can consistently get a higher price for performing the same job, they will increase contract rates to where the market will support them.
In many other industries, a steady increase of price is the norm, or stable inflation. There are instances, specifically in technology where the cost of an item falls as technology improves. Purchasing a top of the line plasma television set in 2004 could cost as much as $10,000, whereas a much higher quality ultra HD 4K TV of similar dimensions can be had for under $1,000 today. The price fell, due to decreasing costs. Rarely do prices drop without costs falling first. The highly fragmented trucking market does not follow this rule.
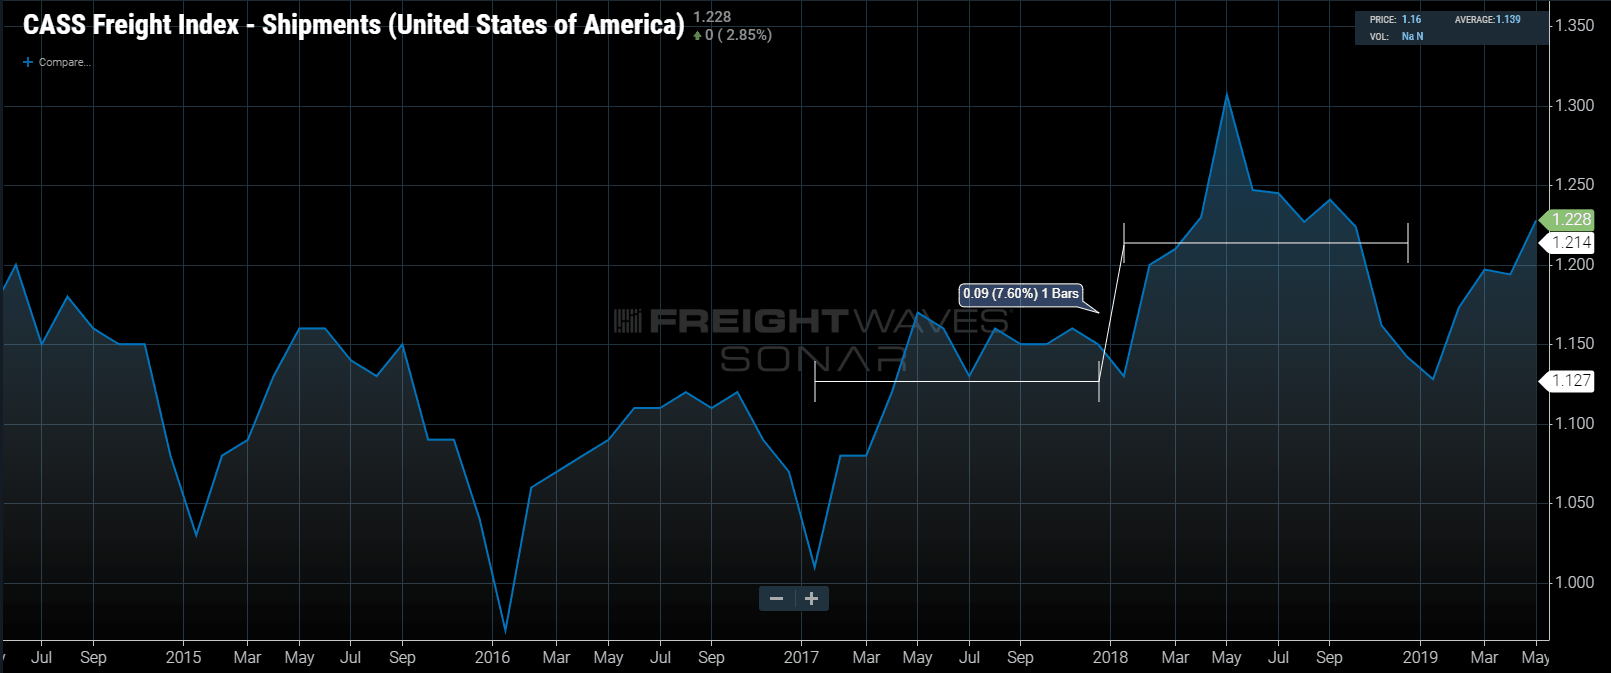
Most people involved in transportation over the past five to ten years would agree that 2018 was a bit of an anomaly in terms of volumes and increasing rates. Looking at the Cass Shipments Index and DAT national van freight rate index, this is apparent.

The Cass Shipments Index measures total freight volumes using invoices and has a strong correlation with total volume moved in the U.S. 2018 averaged almost 8% higher than 2017. Through the first five months of 2019 the index is averaging 2.5% lower than the first five months of 2018.
Looking at the weekly average of spot rates, 2018 averaged 17% higher than 2017. Rates are currently hovering around the same level they were in June of 2017.
Some might argue this is a good thing for carriers as 2017 was a decent year for freight. 2016 was a soft year and the summer peak produced one of the largest spikes in upward rate pressure in the previous 5 years. The difference is costs have now increased over the past two years as illustrated by the wage growth and maintenance costs.
The wage growth represented in the chart represents all transportation and warehousing jobs, including dock workers and back office. Driver costs, which are a large percentage of carrier costs depending on the size of the company, are estimated as being roughly 11-12% higher compared to 2017.
Many carriers increased the size of their fleets and now have more trucks to utilize, with less freight available. It is difficult for carriers to flex back down when volumes and rates fall as selling equipment is not easy when no one is buying. Their vendors and employees who have taken increases and raises typically do not roll back their newfound income. If this was the peak of freight season the back half may be even more challenging for carriers without a competitive advantage.
About Chart of the Week
The FreightWaves Chart of the Week is a chart selection from SONAR that provides an interesting data point to describe the state of the freight markets. A chart is chosen from thousands of potential charts on SONAR to help participants visualize the freight market in real-time. Each week a Market Expert will post a chart, along with commentary live on the front-page. After that, the Chart of the Week will be archived on FreightWaves.com for future reference.
SONAR aggregates data from hundreds of sources, presenting the data in charts and maps and providing commentary on what freight market experts want to know about the industry in real time.
The FreightWaves data-science and product teams are releasing new data sets each week and enhancing the client experience.
To find out more about SONAR or to setup a SONAR demo.


J
The only things going down in price is technology (AscendTMS, KeepTruckin etc) and air to breath (still free – but I’m sure someone at the DOT is working on taxing it).
Stacy Hill
This is unbelievable…. In Canada it’s even worse. We have shaky companies that create accidents and then reinvent themselves under a new name. AKA Humboldt Saskatchewan, does that ring a bell? Last year things were looking pretty good and we had about a 10% increase across the board in wages. This year without any accidents, any claims, our insurance rates have gone up over 35% and rates have dropped around 13 to 17%. Now to the best of my knowledge there are only two insurance companies in Canada that ensure small trucking companies to travel into the United States. Why? The risk of a loss is too high in litigation crazy United States! Yes we have a driver shortage. But it’s not a shortage of what you think. It is a shortage of quote “Professional Drivers”. I do the hiring for my company…. I put an ad in a local website. I recieved over 65 applications of which only five were marginally qualified. And this only makes sense…. Our insurance company tells us that we have to have three years of experience of which one year must be in the United States in those three years must be contiguous to this day’s date..
I have a friend who has a driving school. In Alberta it costs $10,000 to get your class 1 license for an industry that pays barely more than minimum wage. He is having a difficult time finding people stupid enough to pay out $10,000 for literally as subservient income.
Now don’t get me wrong I absolutely love this industry. I love the travel. I love the responsibilities. I love the FREEDOM of the open road. I have 3 million accident-free miles so I’m marginally experienced. It is Little Wonder there’s a mad rush towards autonomous vehicles. They are coming, make no mistake about it! They will be here sooner than later. Why? Necessity is the mother of invention! And autonomus vehicles are going to become a necessity and in some warped Twisted way…. There is the belief that the highways Maybe safer! In the big picture that Maybe true!
John Boyd
If you take a pay cut because of cheap or slow freight is not wise because you will never get it back. Go to a company who takes it like everyone else and uses it as a business loss on their taxes. Company I worked for did that and bought 2 new trucks now they need 3 drivers
Dan The Driver
It’s a free market. Or maybe I should say free for all market. One & done relationships care nothing about either parties cost. People jump in, then if the market won’t sustain their cost they’ll be gone. This is nothing new. I’ve been watching them come & go for 4 decades. It makes my job exciting!
Jimmy Wells
Absolutely. It’s cyclical. Trying to compete when you’re out of your league will only bankrupt you. Set your rates and stick to them…always. The “gold rush” trucks and duct taped rolling wrecks will fail and/or leave like they always do and the market will self-correct accordingly.
Ryan
Shop labor rates are insane right now. It’s not out of the ordinary to see labor rates at or above $150 per hour. Shops are full because of repairs related to aftertreatment systems so they aren’t going to lower their rates when the bays are filled. Sadly, the increased labor rates don’t lead to better paid, better trained mechanics. Some who are in upper management at dealerships have said they are setting record profits and credited it to what they’re making in the shop. This isn’t the only cost that has increased, as insurance and equipment costs, especially refrigerated and flatbed trailers, have also gone up.
Jimmy Wells
Have you raised your rates with your customers to compensate for the increased operating expenses associated with shop labor?
John Boyd
The rates are as always..if you find idiots to haul cheap freight..Then cheap freight is all you will have.
Jimmy Wells
I haul for my rate only. If I don’t get what I want, I do not dispatch the equipment. Let the duct tape trucks race their way to the bottom. Eventually, they will fail. Hauling for low rates is solely your choice but cry about it because nobody is forcing you to. By using your logic there would only be fast food and no need for decent steak houses or restaurants. There’s Big Macs and filet mignon. No different in the transportation world. You get what you pay for.
Richard sharp
Because of the rates following I had to give up part of raise I got last year that mean I losing about 800 mouth and that hard because good price going up and rent in socal in high and with the gas tax bill now gas going up tomorrow 5 more cents per gallon when is this high price going to stop
Cheryl pollard
I know your feelings, I’m in the same boat
Jimmy Wells
Why not leave California for a better state?
Shiv
Wow