


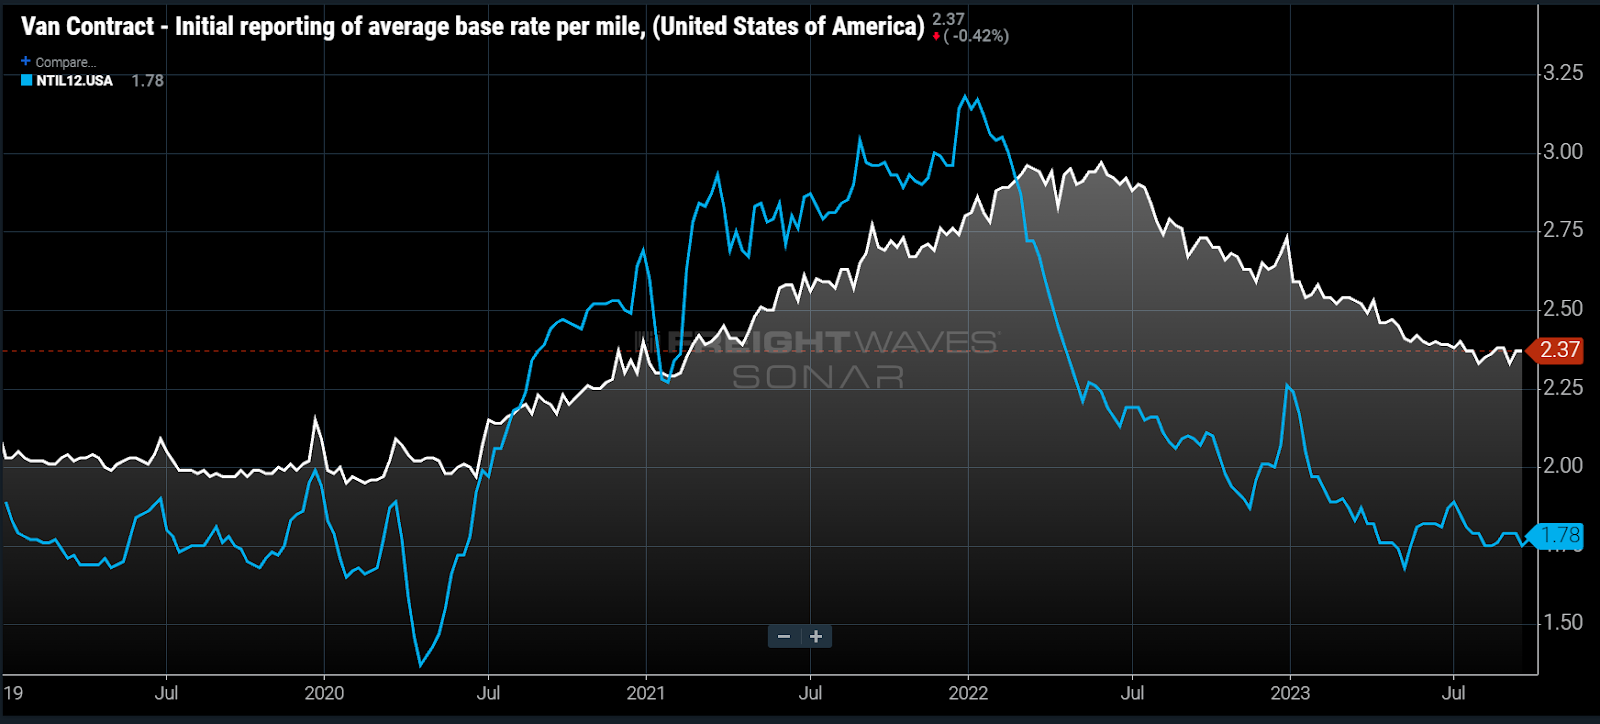
Chart of the Week: Dry Van Contract Rates Initial Report, National Truckload Index excl fuel costs above $1.20/gal – USA SONAR: VCRPM1.USA, NTIL12.USA
The average dry van contract rate (VCRPM1) has been flat since the middle of May, maintaining its historic elevation above the average spot rate excluding fuel costs comparable to a standard fuel surcharge (NTIL12). Is this a function of seasonality or are shippers trading cost reduction for risk management?
Contract rates, according to FreightWaves ~$100 billion database of paid invoices, fell nearly 20% from June 2022 to May 2023, a record pace. Contract rates move slowly in relation to spot rates, which are negotiated with every transaction.
The historic relationship between contract and spot rates has been that contract follows spot. Bigger spreads tend to produce faster contract rate movement.
During the pandemic, capacity tightened too rapidly for a traditional 12-month bid cycle to be effective. Carriers could not handle the sudden flood of demand. Shippers had to bid against one another for carrier capacity, which largely happened on the spot market.
Shippers also used mini-bids as a way of securing capacity for the harder-to-manage lanes on longer-term deals outside of the normal bid cycle cadence. This resulted in contract rates increasing at a record pace, jumping nearly 40% from July 2020 to March 2022.
Tender acceptance rates and length of haul can also influence the movement of the contract rate average, which means this index more than likely moves faster than most shippers’ published rates. But directionally they should be in alignment with experience.
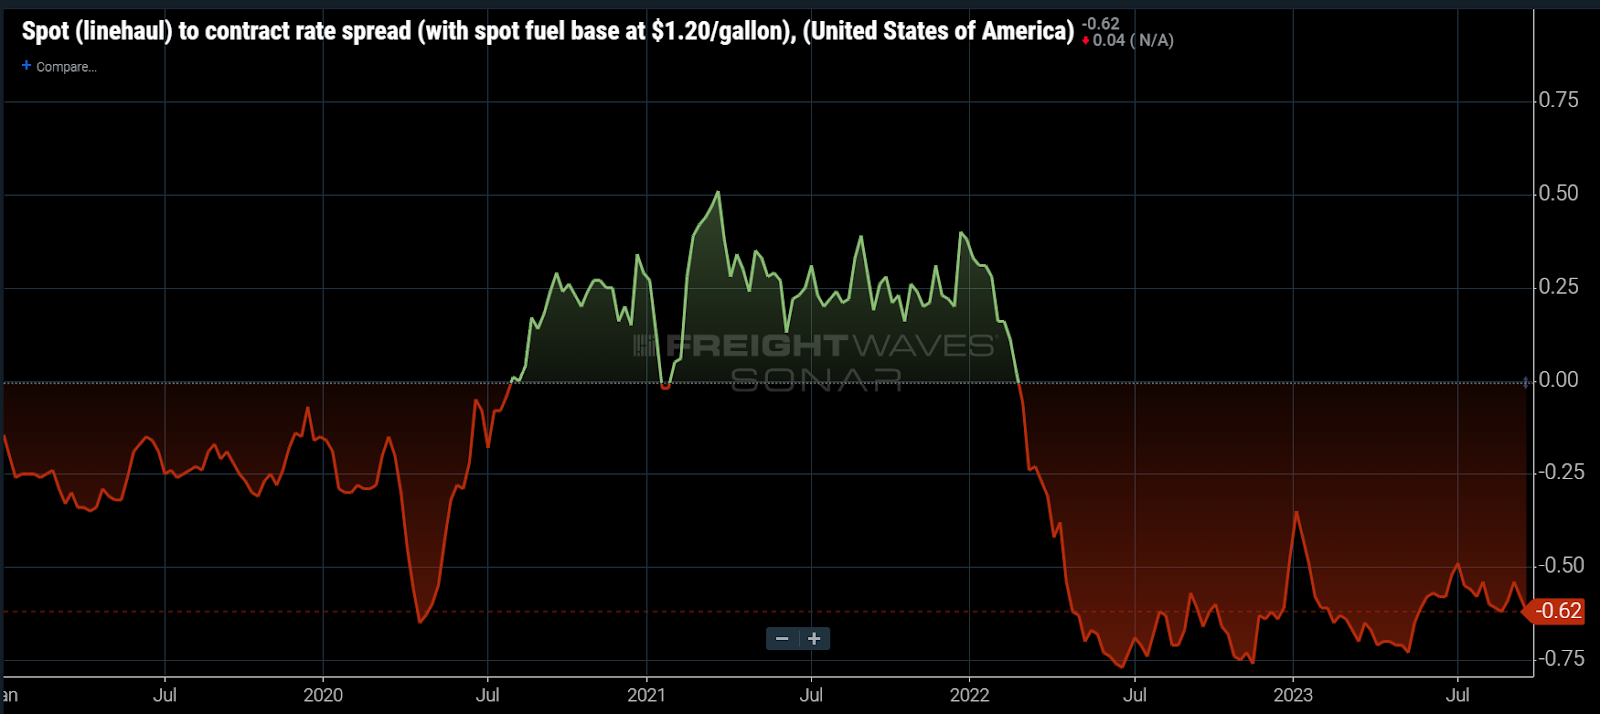
The spread between spot and contract rates has shrunk somewhat, but not anywhere near where it was prior to the pandemic, which was a relatively loose environment. At this point, we would have expected an acceleration in the decline of contract rates, but the opposite has occurred. Why?
Out of season
Traditional bid activity peaks in Q4 and Q1, with most new rate implementations coming in this period. After multiple years of overheated bid activity, shippers are resuming a more seasonal bidding cadence with less activity during peak summer shipping. This was somewhat apparent in 2022, when rates plateaued from April to July.
Riskier business
After being able to pull contract rates back 20%, transportation management strategies could smartly be turning more toward avoiding future service disruptions and away from clawing back costs.
This may be a little idealistic as a theory, but transportation and supply chain managers arguably just went through the most challenging period of their tenures as service failures became the norm. Most of them realize the current capacity oversupply is as unsustainable as the undersupplied pandemic period.
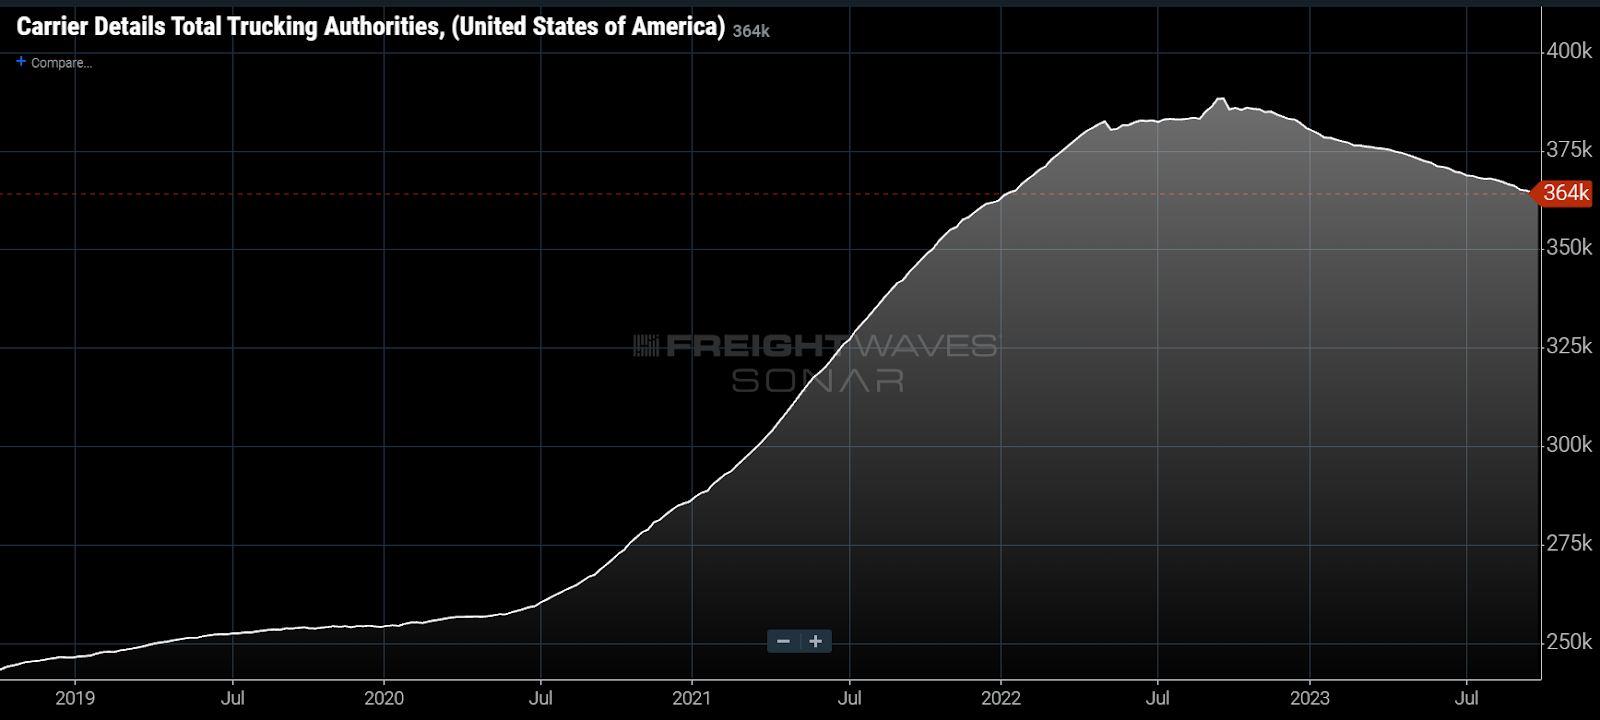
After a year of loose conditions, transportation providers are running through cash reserves built up from the freight boom and starting to fall out of the market. Operating authorities for interstate carriers of property have fallen 6% since last July according to Carrier Details’ analysis of the FMCSA data.
The capacity ceiling is falling and will eventually run into demand and lead to increasing service disruptions.
Mixing it up
It is also possible that freight moving on the spot market is much more heavily skewed toward carrier backhaul freight than ever before. Backhaul loads are shipments in which carriers charge below operating costs in order to get back to more profitable freight or higher demand origins based on their customer needs.
This would increase the gap between contract and spot rates as contract rates represent a more consistently balanced network of freight.
The answer of course is probably a mix of all three. Demand stabilized over the summer as well, which may also be supporting the stabilization of rates. Winter is coming, however, which will be telling on whether the market has truly hit a rate floor or not.
About the Chart of the Week
The FreightWaves Chart of the Week is a chart selection from SONAR that provides an interesting data point to describe the state of the freight markets. A chart is chosen from thousands of potential charts on SONAR to help participants visualize the freight market in real time. Each week a Market Expert will post a chart, along with commentary, live on the front page. After that, the Chart of the Week will be archived on FreightWaves.com for future reference.
SONAR aggregates data from hundreds of sources, presenting the data in charts and maps and providing commentary on what freight market experts want to know about the industry in real time.
The FreightWaves data science and product teams are releasing new datasets each week and enhancing the client experience.
To request a SONAR demo, click here.
White Glove Trucking
It is possible that a higher proportion of back haul freight is putting downward pressure on spot rates. However, the growing sophistcation of AI powered brokers are another reason. In the two years I have had my authority I have witnessed the digital brokers I use grow savier over time. They are offering more freight up for bid which carriers then bid down to very low rate levels. Additionally, the rates across the various brokers have also all converged to become very similar with each other whereas before there were more higher rate outliers to be found if willing to search for them. The high-powered algorithms seem to eliminate pricing lag for brokers, allowing them to price freight at precisely the levels it will move and no more. If the freight market were the stock market, the digital brokers are traders on the floor of the NY stock exchange and we carriers are left holding the ticker tape.
Stephen webster
I talked a small carrier with 2/3 of the freight in contract they do about $5 million a month they are currently loosing between 200 000 and $300 000 a month. They have good shippers under contracts. In ont over 5000 units have been parked already this yr by oct 1 based on information from the M T O. We need a min to max freight range . One account firm said take 88 percent of gross after tolls needs to be at $2cd / mile plus $165 a day for reefer and dry van at $1.86 mile CD plus $125 a day plus tolls or shut down based on fuel at $4.13 US / per Us gal
Bill
Data shows the number of brokers increased dramatically during the pandemic. Spot freight rose to 50% of the market. Now it’s back to the normal 20% and the brokers are cutting rates more than in the past downturns in an attempt to maintain volume. 80% of the TL one way Carriers are operating above a 100 OR and simply can’t reduce rates any further.