Two key measures of freight demand rose in the third quarter, according to U.S. Bank, but at significantly different rates.
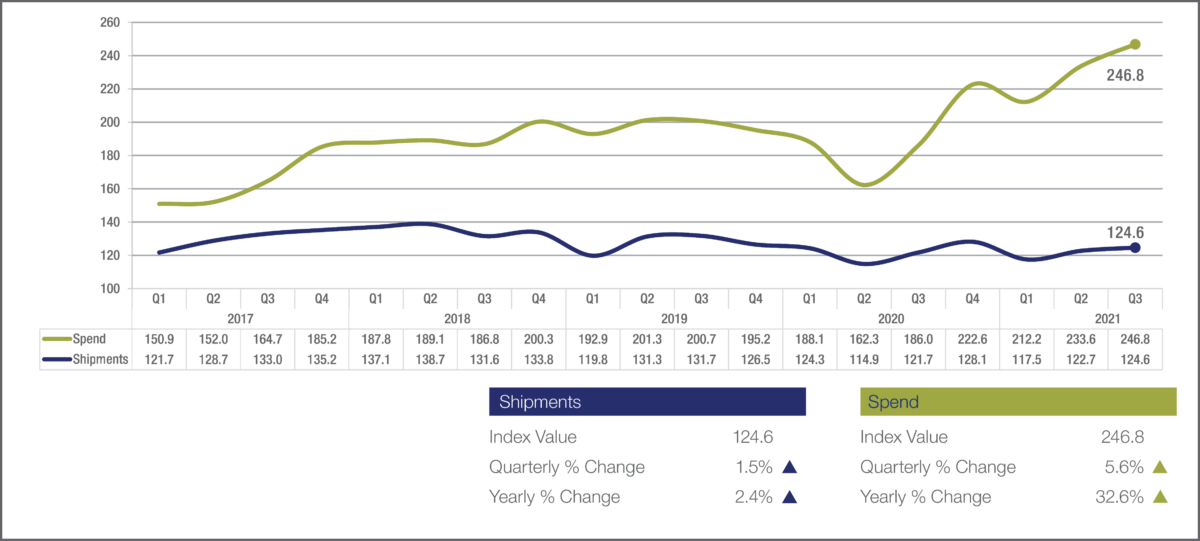
The U.S. Bank National Shipments Index, which measures volume, rose 1.5% from the second quarter, according to just-released data. (NYSE: USB)
But the bank’s National Spend Index, which measures expenditures, climbed 5.6% in the same period.
The data on year-on-year figures is striking as well. For all the focus on the supply chain now, including backups at major ports, the Shipments Index is up only 2.4% from a year ago, suggesting that the amount of freight moving through the system is higher, but not massively so.
However, the Spend Index is up 32.6% from a year ago. The index does include fuel costs, which based on the weekly Department of Energy/Energy Information Administration retail diesel price has risen roughly $1.30 a gallon to its current level of $3.671 a gallon.
The Shipments Index stood at 124.6 for the third quarter while the Spend Index was 246.8. A year ago, it was 186 for the Spend Index and 121.7 for the Shipments Index.
The relative slow growth in the Shipments Index, according to U.S. Bank, reflected “several headwinds.” “This included an increase in the COVID-19 Delta variant, general supply chain constraints and auto plant slowdowns/shutdowns due to supply chain and microchip shortage issues,” the bank said in issuing its report. “In addition, there were seasonal storms, especially in the Southeast region, impacting the quarter’s performance.”

But the index was up overall. U.S. Bank, a major processor of trucking payments, said the “positive contributors” to the index’s rise were “robust port import traffic, solid home construction activity, continued robust household spending for goods and services, solid cross-border truck traffic with Mexico and Canada and improved factory output in some sectors.”
Differences among the regional indices were significant. The Midwest saw a decline in shipments of 0.7% from the second quarter, owing largely to the auto plant issues. In the Southeast, battered by Hurricane Ida and other weather events, shipments were down 2.9%.
But with West Coast ports booming, despite the fact they are backed up, that region saw an increase in shipments of 13.8%, according to U.S. Bank. The Northeast was up 5.1% and the Southwest rose 1.9%.
Year-over-year, the Shipments Index for all regions rose except the Midwest, which was down 5.2%. The West again was the strongest, as it was sequentially for the quarter, with an increase of 17.3%.
“Not surprisingly, the West region saw some very large gains with so much retail and manufacturing freight coming through southern California ports, despite an enormous number of container ships waiting offshore,” the bank’s report said.
Unlike the Shipments Index, the Spend Index is up in all sectors both sequentially for the third quarter and year-on-year.
However, there are significant differences in the size of the increases, even though fuel prices nationally tend to rise at roughly the same amount. California’s diesel prices are higher than the national average, but the rate of growth has trended with the national increases.
The red-hot West Coast has had the biggest increases in costs, according to U.S. Bank. Year-on-year, the Spend Index for the region is up 44% and the quarterly increase is 5.7%.
The other regions have tended to increase at roughly the same rate:
Northeast and Southeast: both up 3.1% quarterly, 31.7% annually.
Midwest: up 3% quarterly, 26% annually.
Southwest: 5.9% quarterly, 26.8% annually.
More articles by John Kingston
Marten brokerage unit’s strong performance contrasts with sluggish truckload results
Fatal collision in Texas leads to $30 million verdict against FedEx Freight
Teamsters update: Yes on new California law, a few new units, 1 decertification looming


