


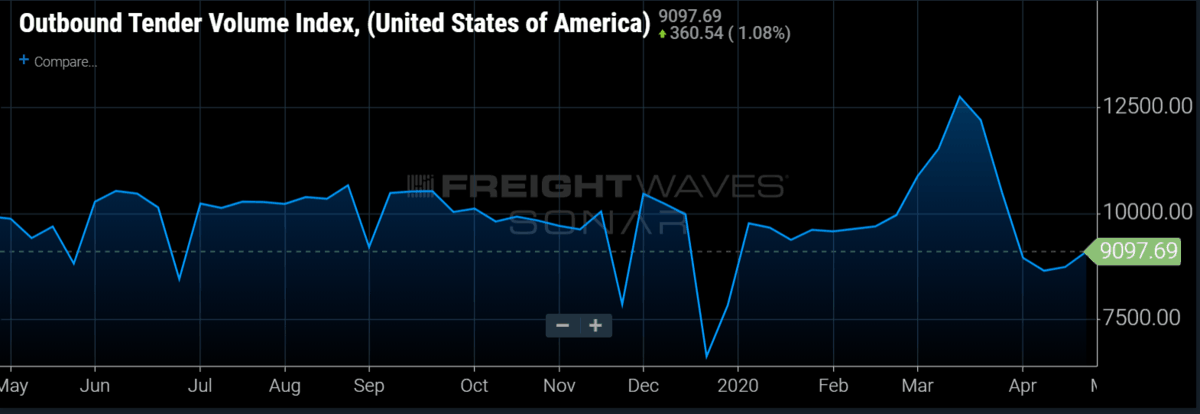
There is life in the outbound tender volume index (OTVI) once again. After two weeks of walking along the x-axis, OTVI has turned to the upside. Volumes have risen just over 4% since last week and have broken the 9,000 mark.
Federal social distancing guidelines expired on Thursday, April 30, and the White House has indicated the restrictions will not be extended. Despite warnings from health and disease experts, half of U.S. states are moving forward with relaxing some restrictions. Unfortunately for freight volumes, most of the businesses reopening are service-based and do not move much freight. However, there was encouraging news for freight volumes out of Detroit this week when the major auto manufacturers set a soft reopening date for May 18th.
It is not that the auto industry moves a high percentage of domestic freight. But auto producers are well-positioned to create the blueprint for a wider manufacturing reopening. The strong union presence of the UAW and other unions may be able to secure cleaner and safer work environments, as well as enough protective equipment. Also, the inherent structure of auto plants makes them better suited for working through COVID-19 for a couple reasons. First, the plants are highly automated and workers use heavy machinery, which means they typically are already wearing gloves; secondly, auto plants are much less dense than say an ecommerce fulfillment warehouse or meat processing plant. It is our belief that auto producers can lead the way towards a manufacturing and industrial reopening. The issue will then be demand, which will be damaged by the economic losses of the next few months.
It may be some time before OTVI reaches pre-crisis levels, but parts of the economy reopening and produce season will increase volumes slowly for the next couple of weeks.
On the positive side, all 15 of the major freight markets FreightWaves tracks were positive on a week-over-week basis. This ratio is a dramatic improvement from recent weeks. The markets with the largest gains in OTVI.USA were Miami (14.15%), Cleveland (13.47%) and Fresno, California (11.83%).
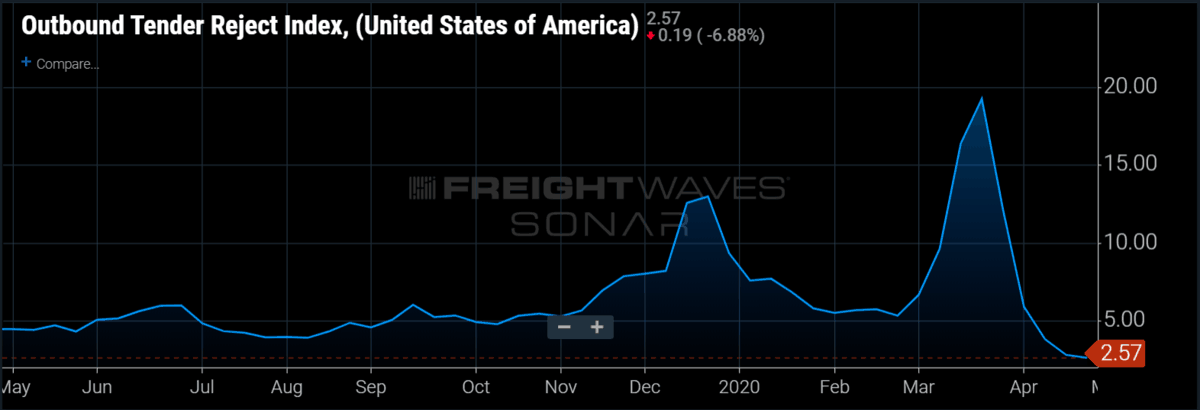
Tender rejections continue to fall, now at an all-time low
Outbound tender rejections have again fallen from a previous series low to an even lower value of 2.57%. This is well below any point in the index’s three-year history.
The index has previously found a support level around 4%, getting close to it but rarely falling below. This is the longest time OTRI has been under that support line, and with volumes at national holiday levels, there is not much pointing towards a rebound.
Since peaking at 19.25% on March 28th, OTRI has plummeted an incredible 85%. OTRI is a measure of carriers’ willingness to accept loads at contracted rates and currently, carriers are moving whatever freight they can find. Contract volumes are beginning to increase, but tender rejection rates will not trend up across the country until capacity is filled in most markets. Currently, this is not the case. Many trucks have been idled and capacity remains loose around the country. The reopening of some industries and the produce harvests will tighten capacity in pockets, but not on a national level.
In terms of pricing power, it is not constructive to either shippers or carriers when volumes are this low. So, to grasp where the power is in this underperforming environment, we must look to pre-crisis capacity, which was already excessive. Although we believe bankruptcies and company failures will reaccelerate during the second quarter, capacity is still very loose right now. Until volumes pick back up, or a swath of drivers leave the market, that environment will remain.
For more information on the FreightWaves Freight Intel Group, please contact Kevin Hill at khill@freightwaves.com, Seth Holm at sholm@freightwaves.com or Andrew Cox at acox@freightwaves.com.
Check out the newest episode of the Freight Intel Group’s podcast here.
David Tildern
Mike, as you can tell the Freightwaves data is just not accurate. The issue in this article is the assumption that the sonar data is reliable. It’s not. It’s way off.
Easily, less than 5% of ALL loads are tendered electronically each day like via EDI. And, Sonar captures only a tiny TINY percentage of that. So the sonar data is simply scewed to just the BIGGEST carriers and BIGGEST Brokers and BIGGEST shippers where the freight is just a little more consistent – and they have also probably been able to shift to more food and medical type loads from customers where the freight dried up completely.
The rest of the market like us (95%) represents everyone else and we are all down 30% to 50%. Shoot, half of our customers are completely closed at the moment and ship 0 loads right now.
In fact, only 2 of our customers send EDI load tenders to us regularly. The other 80 or so send us EMAILS or CALL US. These are NOT captured by Sonar.
Freightwaves has a huge data problem. It looks like you can also see it like the rest of us. It’s just not accurate data and they shouldn’t pretend it is. It hurts people and presents a dangerous picture. It should not be relied upon.
Paul Coltharp
Let’s Fix trucking for the drivers! If you can pass this one to your community https://www.change.org/FixTrucking
Abe F
It’s never been touted as a definitive number/volume. I’ve never seen Freightwaves state “XXX” loads specifically are moving. It’s an index that shows relative strength and movement based upon indicators within the market.
If it’s based upon the largest shippers, largest carriers, largest brokers and what’s happening across those thousands, to 10’s of thousands of tenders – that’s a much more viable understanding of what’s happening vs a small number of emails to small carriers as far as what markets are doing directionally.
Again – understanding what the data IS and what it tells you is important. It’s not an absolute value.
Art
Probably mostly US Xpress load tender data which is not representative of the industry.
Anytime someone questions FW data sources, FW does not respond.
What are you folks hiding?
US Xpress volume X 100 is not the industry.
Mike
I’m rather a simpleton, looking at actual truck volumes on the roads, parked in truck stops and the many truck yards in the Detroit area. I see more parked trucks than I see on the road. Stadium sized lots with trucks and trailers stacked like cordwood. Paid parking lots the same, the trucks just sit. Then my friends in the industry, 30 years of friends. Only have two that are actually running pulling a reefer for big outfits, the rest of us have been sitting for weeks. Some by choice, or like the rest of us, unwilling to work for these miserable rates. How about a story on how many trucks are actually out there running? All I am seeing is a coming financial nightmare in the industry as many of these trucking companies close their doors for good.