(PHOTO: Werner Enterprises)
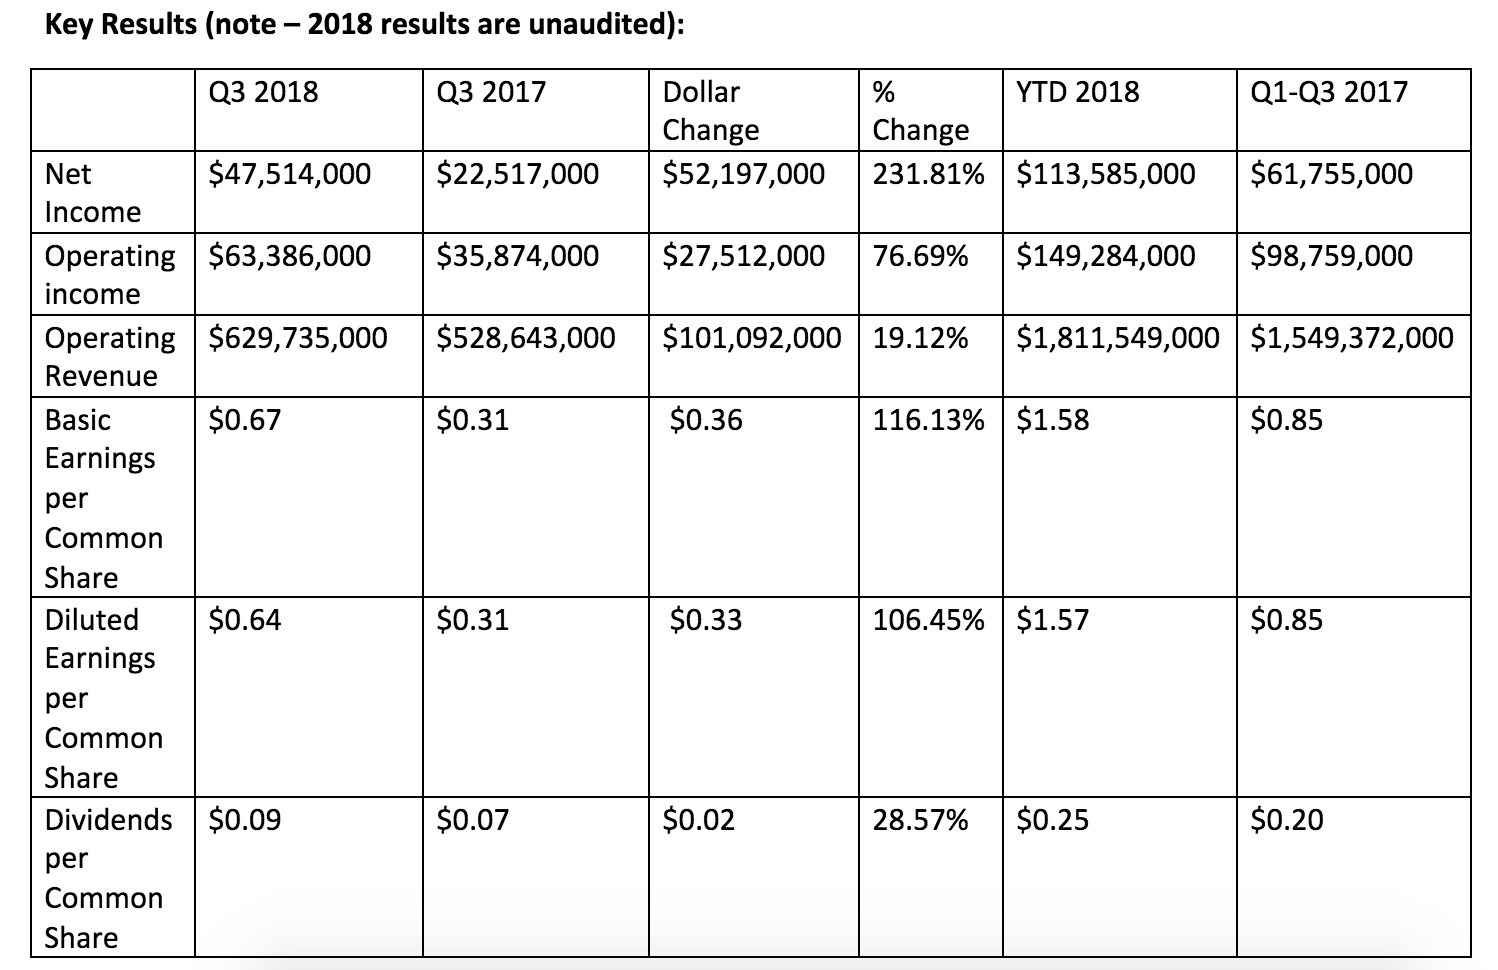
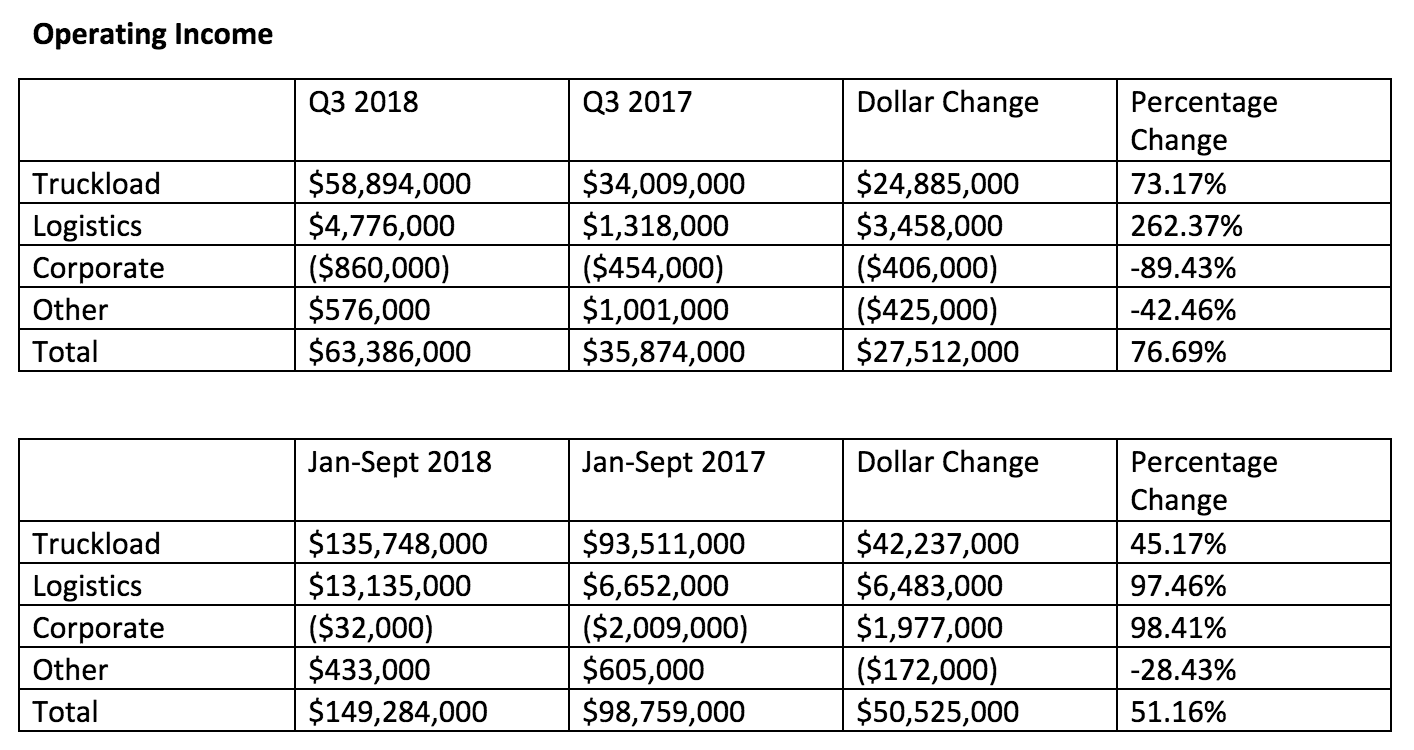
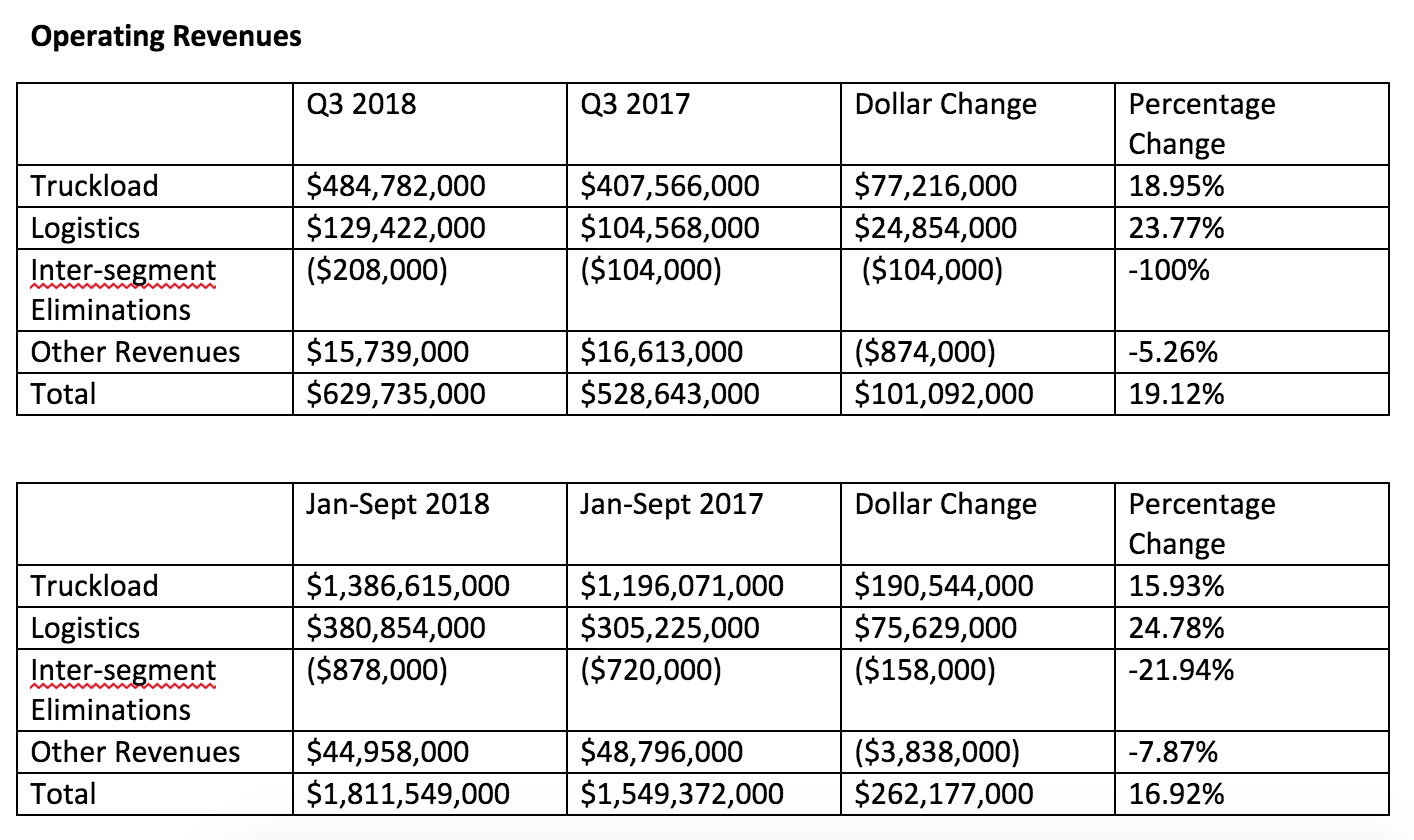
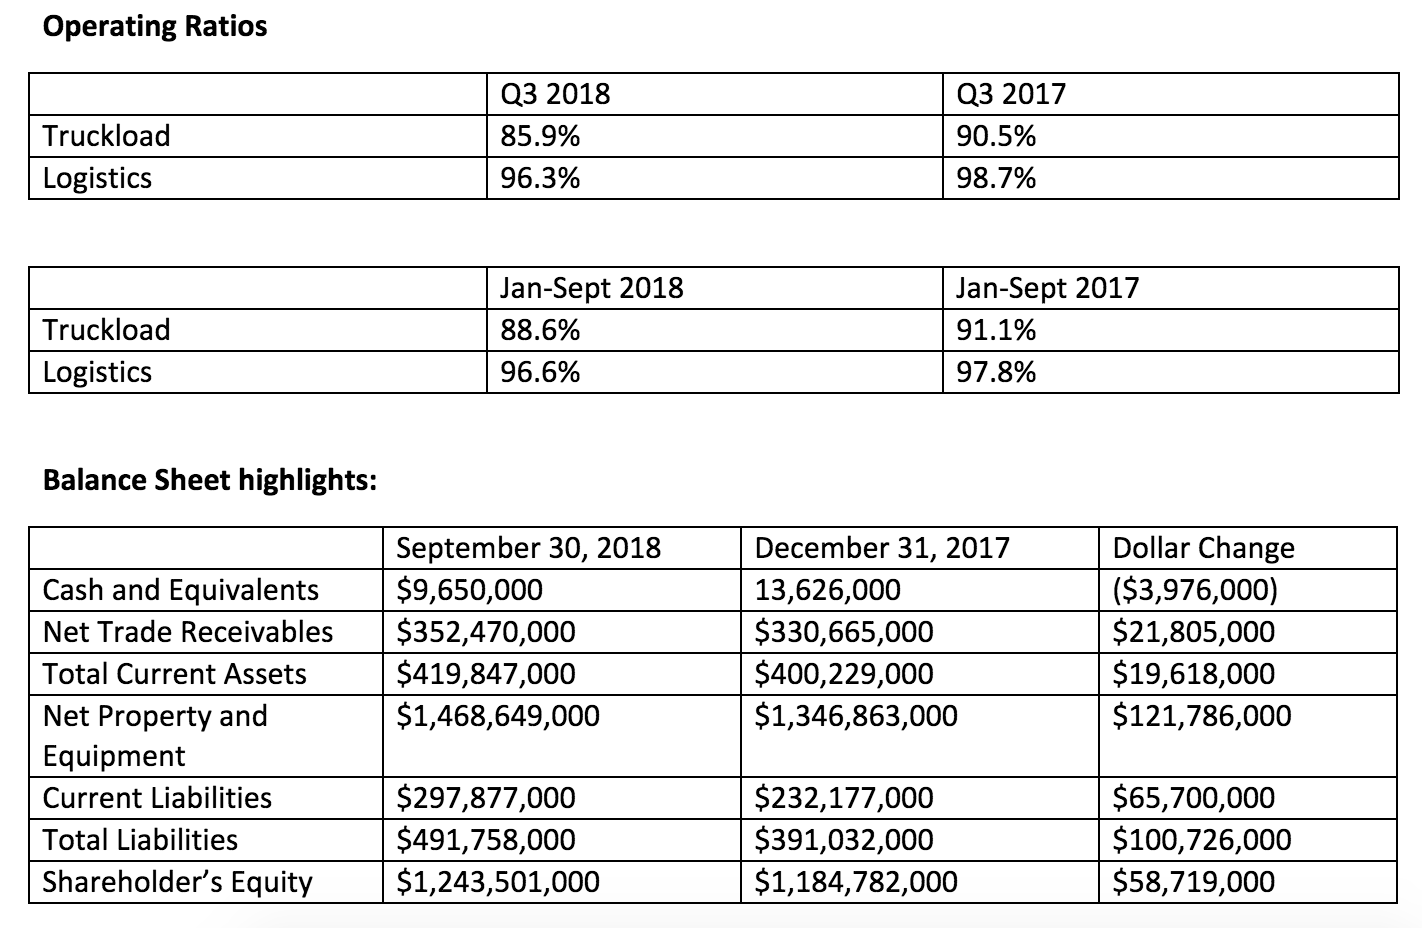
Ever since Clarence Werner used his car as a down payment to purchase a 1956 Ford F-800 truck, effectively kick-starting his entrepreneurial journey, Werner Enterprises has been one of the de facto yardsticks from which all truckload carriers have measured themselves against. In absence of credible and timely private company benchmark results, trucking companies have long used Werner’s public results (one of the most transparent of the publicly-traded trucking companies) to compare the following popular measures: Length of Haul, Revenue per Truck per Week, and Empty Mile percentage, among many others. Aside from the tabulated operational and financial results, a ton of insight can be gleaned (and has been gained by many) from reading the management discussion contained in each of their quarterly and annual reports.
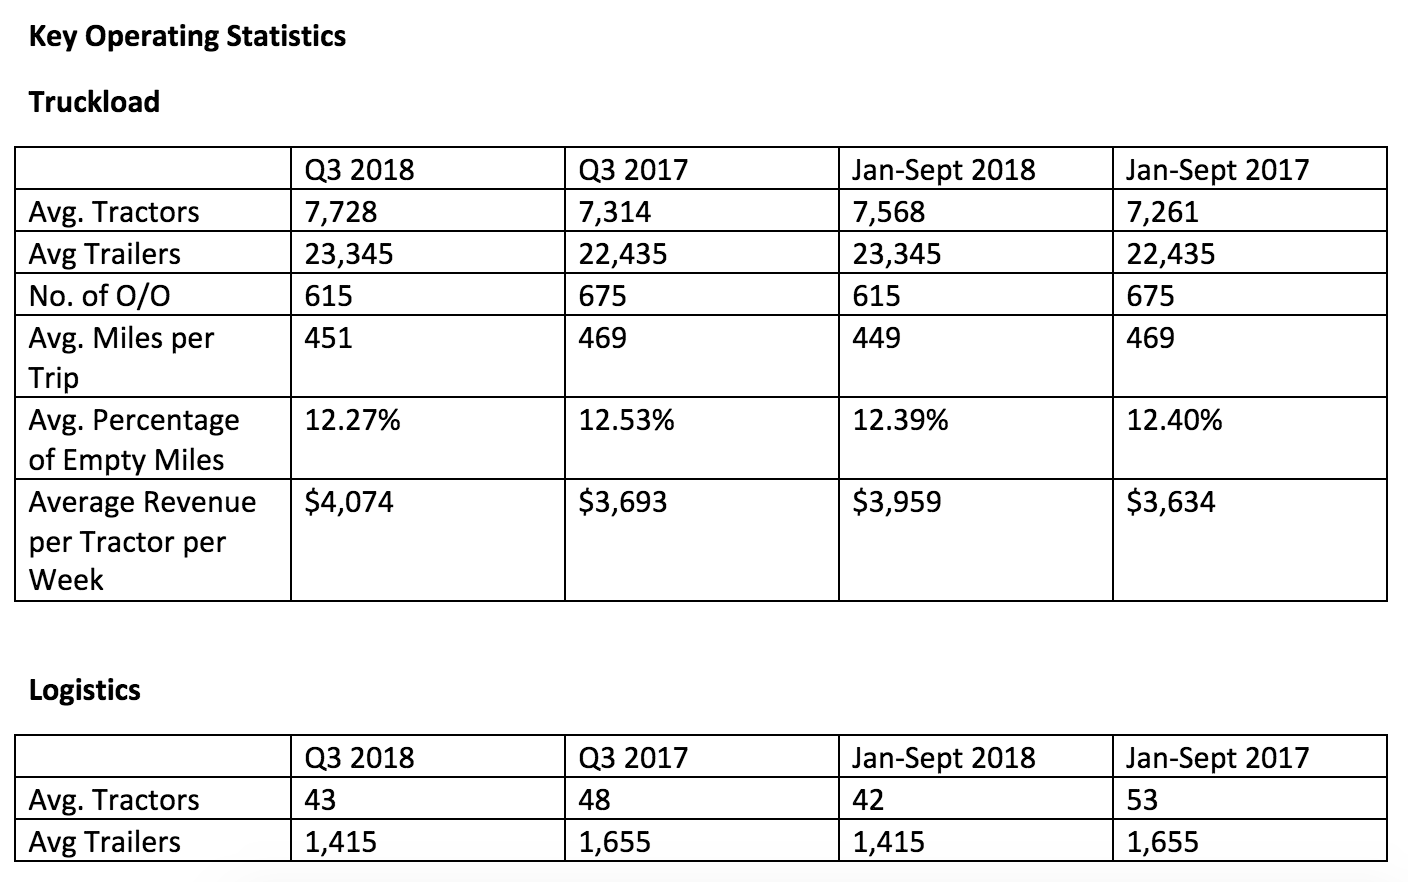
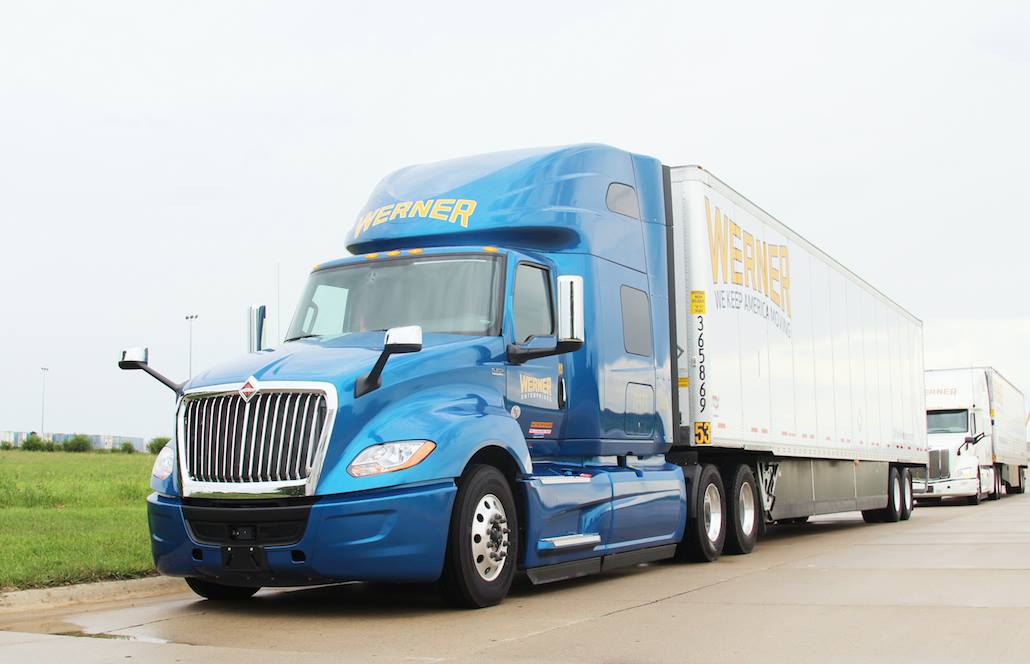
Werner is currently lead by Derek Leathers, who took the wheel in 2016 after several years as Chief Operating Officer. Werner currently operates 7,770+ trucks and a trailer pool of close to 24,000 and has a significant logistics operation.
Having read each report since Q1 2014, I’ve noticed a distinct trend of industry leaders referencing specific data and commentary contained in each of Werner’s report. I highly recommend listening to Werner’s leaders provide their take on the market and economy on one of the many Webcasts and Presentations archive on their website. From Q1 2014 thru Q3 2018, Werner has been the leader in organic shareholder equity growth (Book Value) in the truckload segment (publicly-traded truckload operators). Unlike current share price, Book Value is arguably a more objective view of company performance over the long haul. Further, this metric is one of the simplest to calculate (Total Assets minus Total Liabilities). It’s essentially the net worth of the company. As a by-product, measuring Price to Book Value has long been key measure for value investors such as Warren Buffett. The lower the ratio, the better for value investors.
Here’s a simple comparison of Werner’s Book Value performance over the past 19 Quarters (Q1 2014 thru Q3 2018) versus some other Transportation-specific public companies.

In addition, here’s a simple chart detailing Werner’s Operating performance over the same period.
