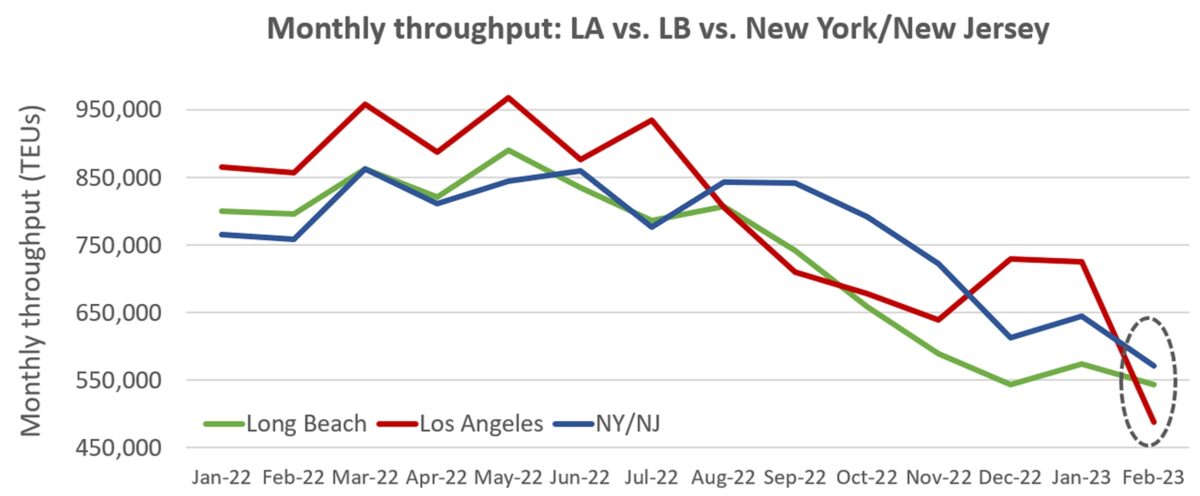
Los Angeles had expected its numbers to be ugly in February — and they were.
“The decline was indeed steep,” acknowledged Port of Los Angeles Executive Director Gene Seroka during a press conference Friday.
Total throughput fell to only 487,846 twenty-foot equivalent units in February, plunging 43% year on year. Last month’s throughput was down 33% from January and 31% from February 2019, pre-COVID.
Los Angeles fell back to third place among U.S. container ports for the month of February. The Port of New York/New Jersey topped Los Angeles during several months in 2022; it did so again in February, taking the top spot with 571,177 TEUs, 17% above Los Angeles.
Long Beach reported February throughput of 543,675 TEUs, 11% above Los Angeles.

Worst month since 2020 Wuhan lockdowns
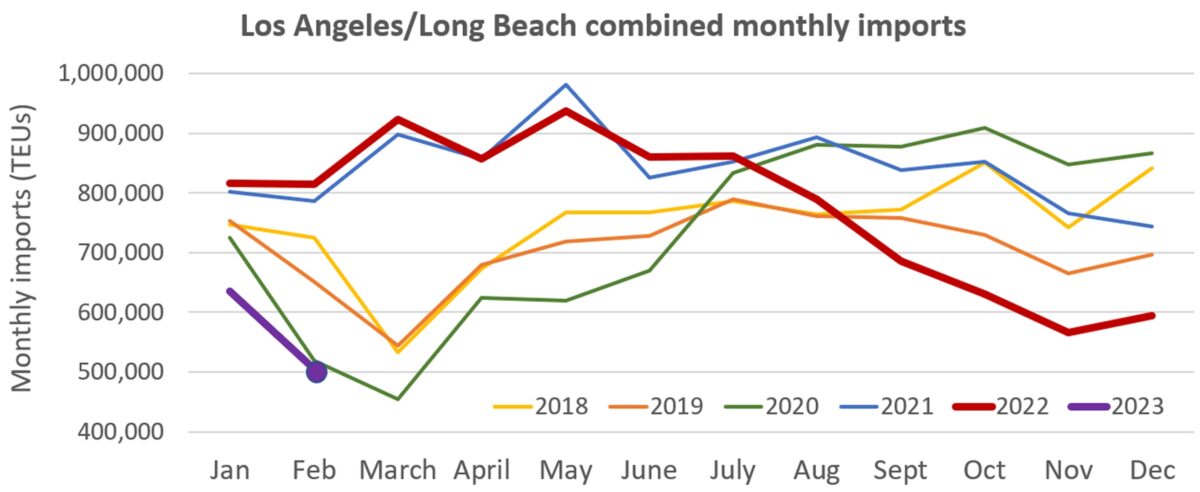
Imports to Los Angeles sank to only 249,407 TEUs. That’s down 41% year on year, 33% month on month and 28% versus February 2019. Los Angeles can handle more than twice February import volumes — it did so on multiple occasions in 2020 and 2021.
Long Beach’s imports totaled 254,970 TEUs, down 35% year on year, 3% month on month and 16% versus February 2019.
Combined Los Angeles/Long Beach imports totaled 504,377 TEUs in February. The only month in recent years the two ports handled fewer combined imports: March 2020, when trans-Pacific trade was shut down by the initial COVID lockdowns in Wuhan, China.

Seroka attributed the “stark decrease” in LA’s February numbers to a mix of factors: a drop in demand that is a “global phenomenon”; inventory levels in the U.S. that are still too high; a Lunar New Year holiday “that packed a harder punch than usual with factories closed longer and weaker orders overall”; and last but not least, the “ongoing longshore labor negotiations.”
The port labor contract between the union and the employers expired on July 1, 2022, over eight and a half months ago. “Cargo owners have made it clear that they want the certainty of a signed deal,” said Seroka.
Asked about progress toward an agreement, he conceded, “I don’t know that we’re any closer.”
With Lunar New Year in the rearview mirror, Seroka expects throughput to reach nearly 600,000 TEUs in March, up more than 20% from February. Nevertheless, LA’s first-quarter volumes are predicted to be down 33% year on year and 21% versus the five-year average.
How much cargo has LA/LB lost for good?
The optimistic theory on Southern California ports is that shippers will bring back volumes once a labor contract is finalized and a labor disruption is off the table.
The counterargument is that much of the volume that shifted to the East and Gulf coasts is gone for good. Fears of congestion and labor unrest may have precipitated the original decision to switch coasts, but now that new supply chains are in place, importers will stick with them even after a West Coast labor deal is reached.
“I think a lot of the transition from the West Coast to the East Coast is permanent, “ said Nerijus Poskus, vice president of ocean strategy at Flexport, in an interview with FreightWaves.
“Many importers used to only have one DC [distribution center] or warehouse on the West Coast, where they would do their international transport from Asia to Southern California. From there, they would do domestic across the country. Because of everything that happened in the last two years, they were forced to open and sign a contract with another DC on the East Coast.
“They can move back, but why would they? Most of your customers live on the East Coast. You were bringing cargo to the East Coast from the West Coast anyway. You’ve built new supply chains. And they’re not necessarily more expensive, because you’re increasing your international cost but you’re reducing your domestic cost,” Poskus said.
“On top of that, you have more shipping services to the East Coast than you’ve ever had before, and the [ocean freight] spread between the East Coast and the West Coast is now very little. For one carrier, it’s down to $850 [per forty-foot equivalent unit], which is almost unheard of. That’s nothing compared to what it costs to truck goods across the country.
“So, I think a lot of this is here to stay,” said Poskus. “People have gotten used to this new reality. I don’t think this has that much to do with the risk of a strike on the West Coast anymore. I don’t see the West Coast gaining all its share back.”

Click for more articles by Greg Miller
Related articles:
- Imports sink again as wholesale inventories remain bloated
- The Fed’s supply chain pressure gauge just went negative
- Container shipping market yet to bottom as spot rates keep slipping
- Container trade’s next turn: Price wars, cheap contracts, new ships
- Maersk: Container shipping contract rates will sink to spot levels
- Beleaguered Los Angeles port pins hopes on 2nd-half rebound
- January imports up from December, but February is looking weak


Don Starr
POLA/POLB = ILWU POWER.
RUDOLFO RUELAS
The negative press always dominates the positive, during the covid pandemic Longshore Workers broke records despite our member’s catching covid and taking it home to their families and losing member’s to this tragic illness! PMA has been trying to break My Beloved Union for decades with no success, for the working man is the backbone of the UNITED STATES of AMERICA. I’ve seen PMA’s tactics and truly despise them,.. because they reap the benefits of the working man while never breaking a sweat in the docks yet they weaseled there way into negotiations for the companies many of which I’ve personally heard them say that they want no part of what PMA is offering and just want to get along and keep their businesses running in an efficient way as they have in the past. Last year alone during the pandemic their salaries increased to proportions that exceeded what they expected and more than they’ve received prior to covid never the less to say they were happy yet PMA convinces them that they could do better. It’s a shame that greed overcomes all even the lives of workers that put their blood, sweat and tears into their work, and still we hold our heads up high PROUD TO BE PART OF SOMETHING BIGGER THAN US… THE ILWU! BIG RUDY ILWU MEMBER!
Salvador Trevino
PMA trying to starve the west coast ports redirecting ships east coast. Corporate Greed
Ned Blinick
I am surprised that anyone is talking about permanence with reference to supply chains. History has shown that supply chains are in constant flux. BCOs are always trying to optimize time vs cost when determining the transportation mix. Carriers are doing the same and will use price to influence routing as it suits them in optimizing their vessel utilization.
thomas fredette
Foreign shipping doesn’t care about your supply chains or how much money you’re saving domestically. They care about turnaround. If LA/LB did their job like they’re supposed to, the Asian ships can pull in, unload and load up the empties and be on their way, while the other scenario has them waiting down at the Panama Canal, traversing the Gulf of Mexico and chugging their way up the entire Eastern seaboard!
And then coming all the way back? Ridiculous!