What’s going on in dry bulk, the world’s largest transport market by volume, is a cautionary tale for all ocean segments.
The Jan. 1 implementation of IMO 2020, the global switch to low-sulfur marine fuel, is coinciding with a seasonal cargo-demand slump. Because bulker owners and operators must pay for the fuel in spot contracts, they’re netting even less as they’re having to cover the incremental cost of IMO 2020-compliant fuel.
In the spot market for “workhorse” Capesizes (bulkers with capacity of around 180,000 deadweight tons), vessel interests do not have enough negotiating power to pass along any of the costs of more expensive low-sulfur fuel to cargo interests.
As Breakwave Advisors said in its latest market report, “Charterers have managed to hold voyage levels steady regardless of IMO 2020. Despite significantly higher fuel prices as a result of the IMO 2020 transition, voyage rates failed to adjust upwards as a number of market participants anticipated, signifying a major win for dry bulk charterers.”
Breakwave Advisors added, “The Capesize dry bulk market is dominated by four to five major charterers, and as such, the pricing power of the hundreds of shipowners diminishes during relatively weak periods.”
Platts’ dual indices
S&P Global Platts is offering one of the clearest views on what’s going on in dry bulk vis-à-vis IMO 2020.
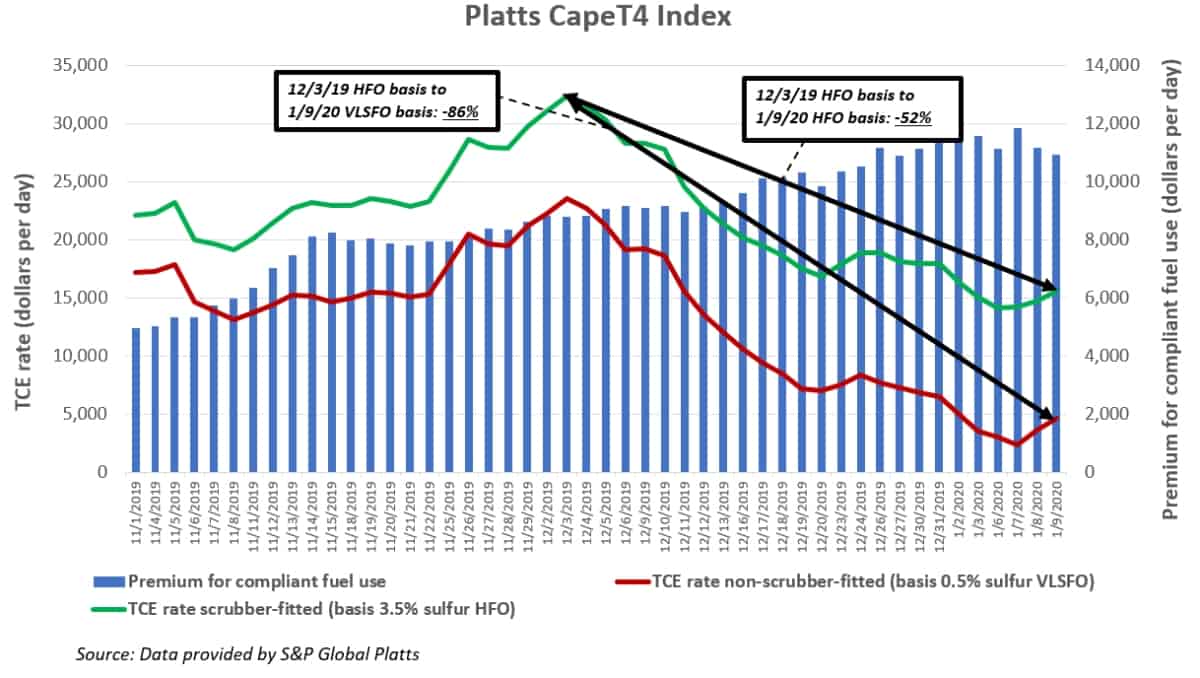
On Oct. 1, Platts debuted its CapeT4 Index, a weighted average of assessments of four Capesize round-trip voyages. On Nov. 1, Platts debuted dual CapeT4 indices, one for ships burning more expensive IMO 2020-compliant 0.5% sulfur fuel known as very low sulfur fuel oil (VLSFO) and one for ships equipped with exhaust-gas scrubbers that are still allowed to burn the cheaper traditional 3.5% sulfur heavy fuel oil (HFO).
Platts derives its index values by starting with the spot rate, charged in dollars per tons of cargo, then translating that into a time-charter-equivalent (TCE) rate measured in dollars per day, which is net of expenses such as fuel. As the cost of fuel increases, spot TCE decreases.
In response to a request from FreightWaves, Platts provided all of the data for its dual CapeT4 indices and the main component indices for the IMO 2020 transition period.
TCE rates for Capesizes consuming HFO (i.e., those with scrubbers after Jan. 1) have fallen from a recent peak of $32,368 per day on Dec. 3, 2019, to $15,558 per day on Jan. 9, a decline of 52%.
Over the same period, the spread between HFO and VLSFO has widened, with Platts’ assessment of the implied premium a Capesize owner must pay for compliant fuel rising from $8,810 per day on Dec. 3, 2019, to $10,928 on Jan. 9, an increase of 24%.
Ships without scrubbers were burning HFO before Jan. 1 and VLSFO after. As a result of the fuel transition and the widening fuel spread, their implied TCE rate, according to the Platts CapeT4 index, fell from $32,368 per day burning HFO on Dec. 3, 2019, to $4,630 per day burning VLSFO on Jan. 9, a decline of 86% over the IMO 2020 transition period.

Platts’ individual trade-lane indices provide a closer look at what transpired in the global Capesize sector.
The weightings that make up the CapeT4 index are a mix of four round-trip voyages: Australia-China (46%), Brazil-China (45%), South Africa-China (6%) and trans-Atlantic (3%). Platts believes this mix is the most accurate reflection of the global market, based on its cFlow vessel-tracking software, which measures ton-mile demand (cargo volume multiplied by distance) in each lane.
Given such weightings, global pricing moves are clearly being driven by Australian exports and/or Brazilian exports. How does each compare?
Australia-China Capesize pricing
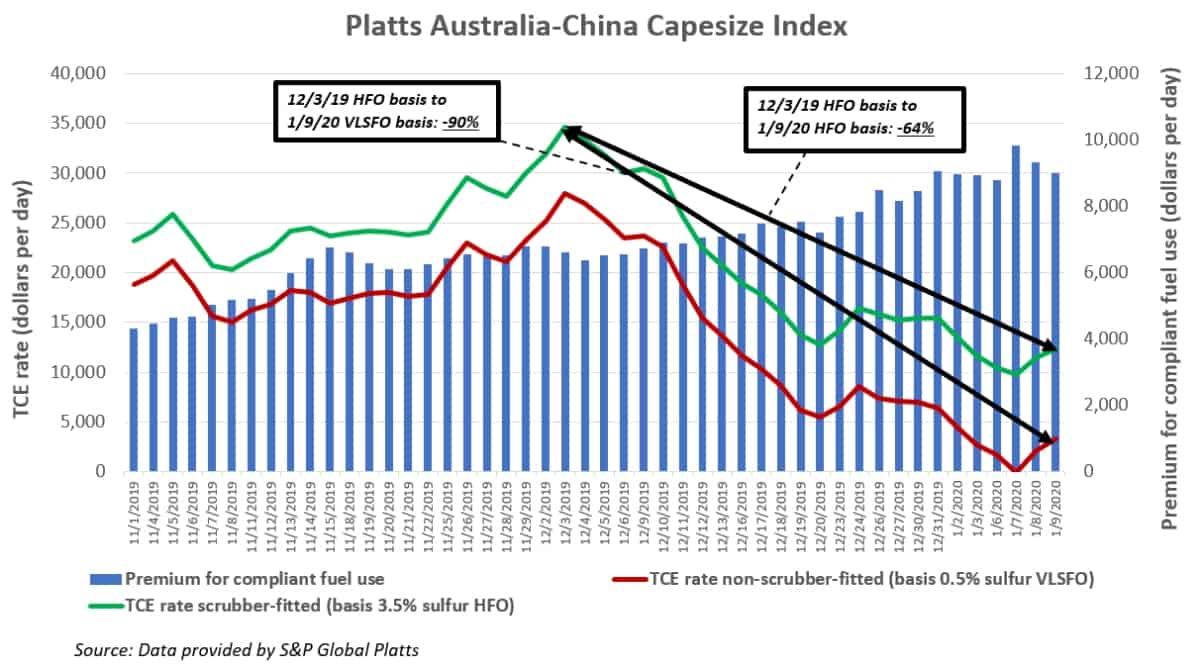
According to the Platts index, Capesizes consuming cheaper HFO and sailing from Port Hedland, Australia, to Qingdao, China, have seen TCE rates seasonally fall from a recent peak of $34,592 per day on Dec. 3, 2019, to $12,333 per day on Jan. 9, a decline of 64%.
Over the same period, the implied premium a Capesize owner must pay for compliant fuel on this trade lane rose from $6,618 per day on Dec. 3, 2019, to $9,014 per day on Jan. 9, an increase of 36%.
In the Australia-China market, ships without scrubbers saw rates plunge from $34,592 per day burning HFO on Dec. 3, 2019, to $3,319 per day burning VLSFO on Jan. 9, a decline of 90% over the IMO 2020 transition period.

In the Australia-China trade lane, the VLSFO-HFO fuel spread has increased faster than in the global CapeT4 index, and the rates for scrubber ships (which have been able to continue to burn HFO) have fallen more steeply than in the CapeT4.
In fact, the Pacific Capesize market has been so hard hit by the combination of low demand and high fuel costs that the TCE rate for VLSFO-burning ships briefly turned negative on Jan. 7 (-$98/day) before rebounding. In other words, the cost of fuel for a voyage fleetingly exceeded what a ship without a scrubber would earn.
Brazil-China Capesize pricing
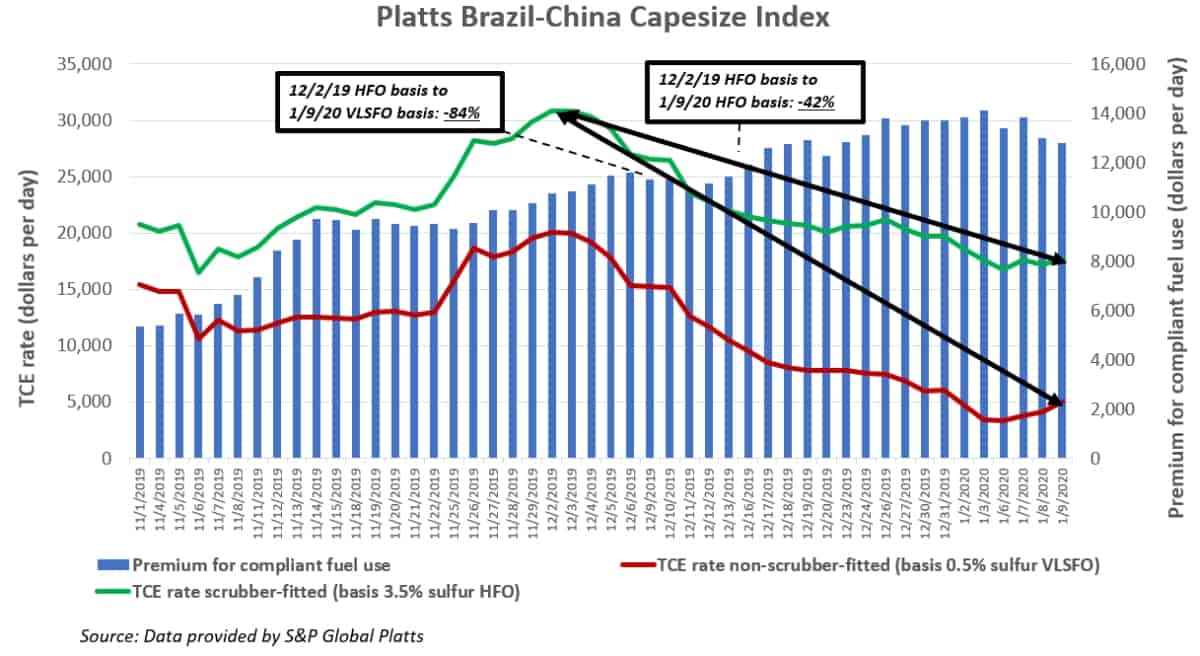
Capesizes consuming HFO and sailing from Tubarao, Brazil, to Qingdao, China, have seen TCE rates seasonally fall from a recent peak of $30,813 per day on Dec. 2, 2019, to $17,821 per day on Jan. 9, a decline of 42%.
Over the same period, the implied premium a Capesize owner must pay for compliant fuel on this trade lane rose from $10,740 per day on Dec. 2, 2019, to $12,816 per day on Jan. 9, an increase of 19%.
In the Brazil-China market, ships without scrubbers saw rates fall from $30,813 per day burning HFO on Dec. 2, 2019, to $5,005 per day burning VLSFO on Jan. 9, a decline of 84% over the IMO 2020 transition period.

The takeaway from the Platts data is that rates in the Brazil-China market appear to have suffered less of a seasonal decline than those in the Australia-China trade over the past month. Also, the premium of VLSFO over HSO has been widening at a slower pace in the Atlantic than in the Pacific Basin.
The Platts indices imply that today’s biggest dry bulk headwind is pressure in the Pacific, both in terms of rising fuel spreads and steeper seasonal declines in spot rates.
Other Capesize rate estimates
Platts’ CapeT4 is a newcomer. It’s trying to compete with the long-established index mainstay administered by the U.K.’s storied Baltic Exchange — the Capesize 5TC Index. The methodology used by the Baltic Exchange for its time-charter indices is much different from the methodology used by Platts, so it’s no surprise that the numbers diverge. What’s surprising is how different the numbers are.
The Baltic Exchange methodology starts with broker rate assessments of time charters, and when those are not available, extrapolates the TCE from spot rates (instead, Platts always starts with spot rates). The Baltic 5TC also features a different route mix: China-Australia round-trip (25%), China-Brazil round-trip (25%), trans-Atlantic roundtrip (25%), Europe-to-Canada (empty) then Canada-to-China (full) one-way (12.5%), and China-to-Europe one-way (12.5%).
FreightWaves was provided the daily Baltic 5TC assessments from Nov. 1, 2019, through Jan. 9, 2020. Unlike Platts, the Baltic does not have dual indices for scrubber and non-scrubber ships. Its time-charter indices have referred to non-scrubber ships since April 1, 2019.
The Baltic 5TC and the Platts low-sulfur CapeT4 were relatively correlated in November. But no longer. The Baltic assessments for non-scrubber Cape rates are now considerably higher than the Platts non-scrubber assessments.
As of Jan. 9, the Baltic 5TC was at $9,199 per day, effectively double the Platts non-scrubber assessment of $4,630 per day.
For investors trying to gauge dry-bulk earnings in the era of IMO 2020 using such index tools, the question is: Which one of these two indices is closer to reality? Is the current market for most Capesizes, beset by both seasonality and regulations, as bad as it looks from the Baltic 5TC rate — or is it even worse, as implied by Platts CapeT4? More FreightWaves/American Shipper articles by Greg Miller


