Chart of the Week: Truckstop.com 7-day rate per mile Flatbed/Van/Reefer – USA SONAR: TSTOPFRPM.USA, TSTOPVRPM.USA, TSTOPRRPM.USA
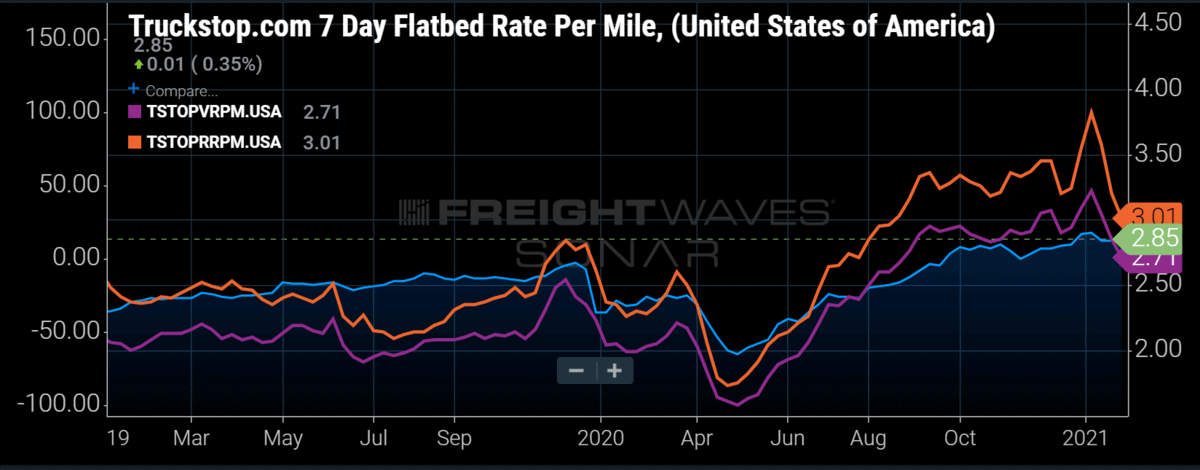
After spending much of 2020 below van and reefer levels, flatbed spot rates have surpassed their van cousins this month, with the gap narrowing on reefer. According to Truckstop.com’s seven-day average spot rates reported by its users, the average flatbed spot rate moved up a cent to $2.85 per mile this past week while van rates fell dramatically from $2.85 to $2.71 per mile. Historically speaking, this is more of a return to normalcy as it is unusual for flatbed to be cheaper than dry van trailer freight on the spot market. After a relatively disappointing 2020, compared to the other modes, could this be the year of the flatbedder?
Looking at the chart, flatbed spot rates did not fall as strongly as van and reefer did in April but recovered much more slowly. Understanding the nuances of the flatbed market can also tell us about the health of the broader economy. The flatbed sector is tied closely to industrial production and construction. The former sector still has yet to fully recover from the initial blow of the pandemic whereas the latter has had much more resilience, especially within the residential segment.

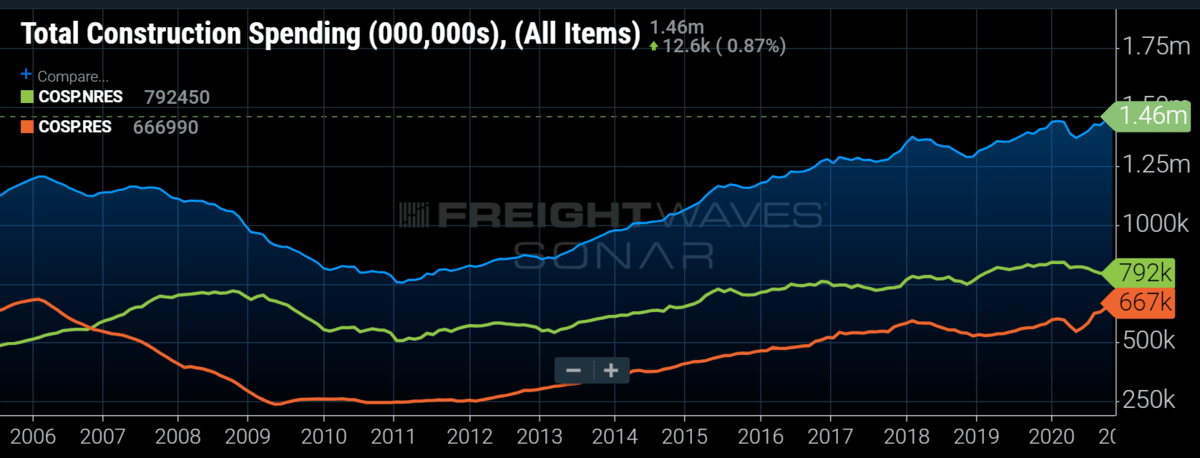
Total construction spending never fell below previous-year levels in 2020, even as nonresidential construction has fallen nearly 6% since March and 5% y/y. Low housing inventory paired with a surge in demand for suburban housing, with many people now able to work remotely, has pushed residential construction spending to its highest levels since 2006.
Even with the industrial sector limping along, expectations are high for 2021, with many forecasting a rapid economic recovery once the pandemic subsides. This could lead to a recovery in business investment, though many eyes will be on the new administration for changes to the current corporate tax structure. Regardless, many companies have been sitting on cash, waiting for more certainty in the economy before spending.
There is little doubt that consumer spending pattern changes drove most of the freight demand in 2020, which is why van and reefer rates blew past flatbed in the summer — not many Amazon orders move on an open-deck trailer. Most consumer products move on van and reefer equipment.

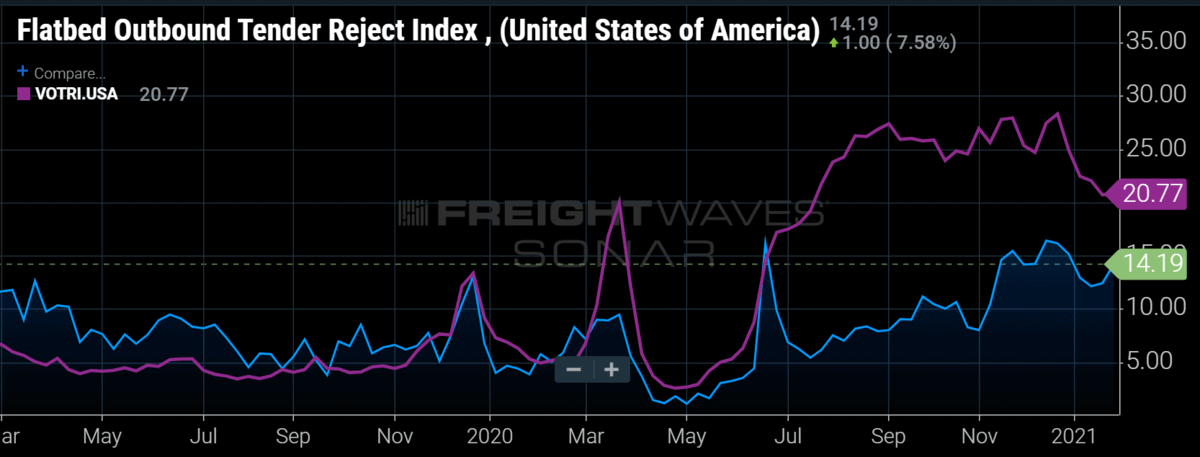
Unlike van, most flatbed freight moves on the spot market due to inconsistent destinations and wild seasonal swings in demand for commodities conducive to the open-deck equipment type. Contracted or long term-rate agreements are reserved for a handful of commodities like automotive and equipment manufacturers, but they are seeing decreasing compliance levels, with carriers rejecting over 14% of their electronic tenders based on FreightWaves Flatbed Outbound Tender Reject Index.
More important than the value is the direction of the index, which has seen a sharp rise over the past week, in opposition to the van rejections that account for most of the contracted freight market. While this recent move may be short-lived, it is part of a longer trend of increasing rejection rates that started in May.
Capacity remains tight in all three modes, but flatbed rates have not been as volatile as the other two and have increased more steadily over a long stretch of time. Statistically speaking, this means it is likely more sustainable than some of the short jumps seen in the van and reefer rates around the holidays and back in March.
Flatbed is also supported by sectors with longer cycles, versus the fickle consumer side, which is driven by a lot of emotion. Although many questions remain for trucking in 2021, flatbed appears to be poised for a much stronger year.
About the Chart of the Week
The FreightWaves Chart of the Week is a chart selection from SONAR that provides an interesting data point to describe the state of the freight markets. A chart is chosen from thousands of potential charts on SONAR to help participants visualize the freight market in real time. Each week a Market Expert will post a chart, along with commentary, live on the front page. After that, the Chart of the Week will be archived on FreightWaves.com for future reference.
SONAR aggregates data from hundreds of sources, presenting the data in charts and maps and providing commentary on what freight market experts want to know about the industry in real time.
The FreightWaves data science and product teams are releasing new data sets each week and enhancing the client experience.
To request a SONAR demo, click here.


