This week’s FreightWaves Supply Chain Pricing Power Index: 40 (Shippers)
Last week’s FreightWaves Supply Chain Pricing Power Index: 40 (Shippers)
Three-month FreightWaves Supply Chain Pricing Power Index Outlook: 40 (Shippers)
The FreightWaves Supply Chain Pricing Power Index uses the analytics and data in FreightWaves SONAR to analyze the market and estimate the negotiating power for rates between shippers and carriers.
This week’s Pricing Power Index is based on the following indicators:
Tender volumes are worryingly unseasonable
When comparing trends in volume from previous years, it becomes clear that freight demand is diminishing in a highly unseasonable way. While the market may have gotten a pass in the traditionally slow month of July, historical trends indicate the Outbound Tender Volume Index (OTVI) begins to pick up steam in mid-July and continues to rise throughout August.
For reference’s sake, these August gains were seen in 2021, when freight demand reached a fever pitch; in 2020, when the industry was recovering from early pandemic shocks; and even in 2019, the year of the trucking market’s previous downturn. This variety of comps underscores the infirmity of the truckload market in the third quarter of 2022.
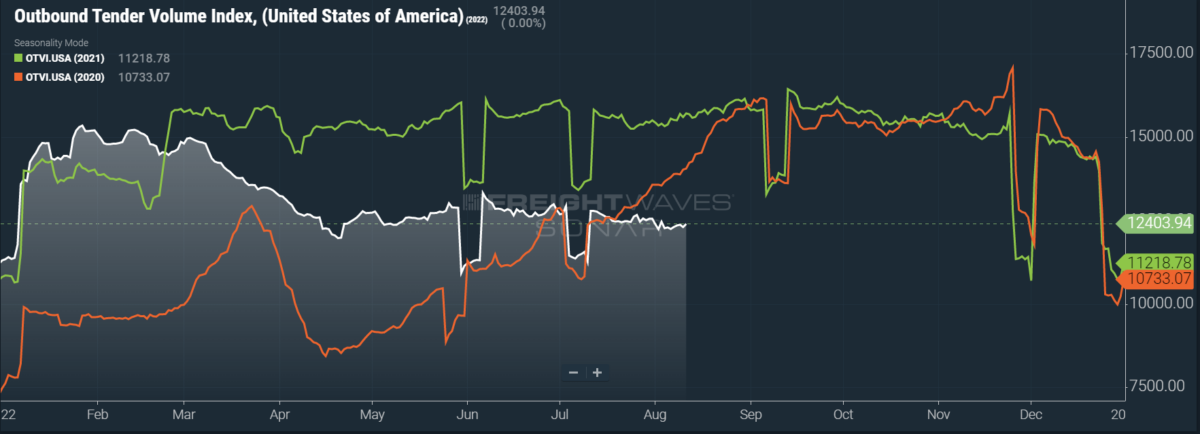
SONAR: OTVI.USA: 2022 (white), 2021 (green) and 2020 (orange)
To learn more about FreightWaves SONAR, click here.
OTVI rose a slim 1.1% on a week-over-week (w/w) basis as high inventory levels negate the need for shippers to move much freight. On a year-over-year (y/y) basis, OTVI is down 20.1%, although y/y comparisons can be colored by significant shifts in tender rejections. OTVI, which includes both accepted and rejected tenders, can be artificially inflated by an uptick in the Outbound Tender Reject Index (OTRI).
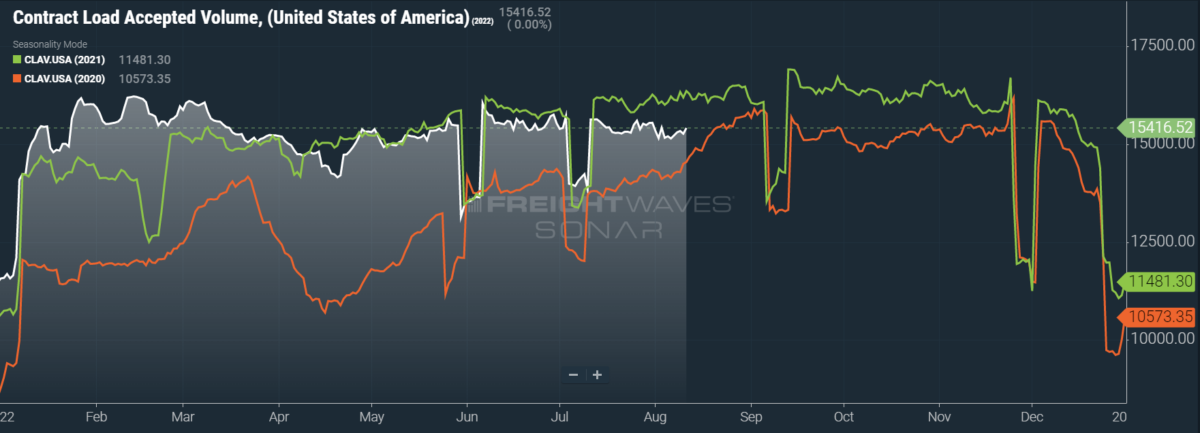
SONAR: CLAV.USA: 2022 (white), 2021 (green) and 2020 (orange)
To learn more about FreightWaves SONAR, click here.
Contract Load Accepted Volume (CLAV) is an index that measures accepted load volumes moving under contracted agreements. In short, it is similar to OTVI but without the rejected tenders. Looking at accepted tender volumes, we see a slight gain of 1.6% w/w but also a fall of 5.8% y/y. This y/y difference confirms actual cracks in freight demand — and not merely OTRI’s y/y decline — are driving OTVI to lower levels.
Despite flagging tender volume on the roads, the maritime side of the shipping industry continues to report sustained import levels. The CEO of a major container shipping line recently stated his belief that the “U.S. consumer seems to be holding up reasonably well,” given y/y growth in trans-Pacific volumes during the first half of 2022. The company’s CFO, meanwhile, downplayed concerns of U.S. import “demand falling off a cliff.”
French composer Claude Debussy famously said that “music is the space between the notes.” As such, I firmly believe there is an art of reading between the lines on earnings calls such as these. Take, for instance, the comments of Shelley Simpson, who was recently named president of J.B. Hunt, during the company’s latest earnings call: When asked about a similar dropoff in freight demand, she responded by saying that “we have seen a more seasonal July” in 2022.
This statement, or so I believe, is a very diplomatic way of stating that volumes were soft in July. The fact that J.B. Hunt had not heard reports from its customers about a slowdown in freight demand is hardly surprising. By indicating that they expect their volumes to fall in the second half of 2022, shippers would be giving up leverage in future rate negotiations.
So, there are a few caveats to be considered when reviewing the aforementioned CFO’s comments. One is that the data, to which the executive obliquely referred, pointed to a drop in import volumes that would not (assuming a 29 day transit time from China to the West Coast) materialize until July. The CFO, however, was discussing performance in Q2, which ends in June.
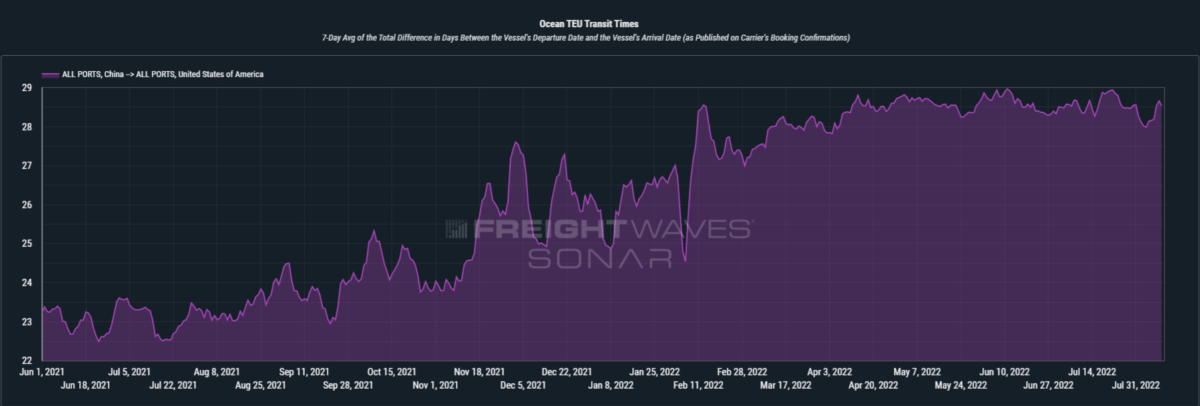
SONAR: Container Atlas: Ocean TEU transit times (in days) from China to the United States (purple)
To learn more about FreightWaves SONAR, click here.
As it turns out, there was a significant drop in TEUs cleared by U.S. Customs and Border Protection 29 days after June 7, when the trend was noticed. To be exact, these maritime TEUs fell 35.25% over that 29-day period. Nevertheless, many of the busiest U.S. container ports will continue to be supplied by an extensive backlog.
But I digress: The original question was one of current import demand, not lingering port congestion. By the liner CEO’s own admission, “there is a fairly material easing of demand.” This easing is evidenced by ocean spot rates suffering a quarterly “decline of 27%,” a trend expected “to continue in the remainder of the year.”
What does all this ocean stuff mean for trucks? Obviously, a substantial portion of goods moved over the road consists of imports. While import demand in the U.S. has weakened with no signs of a quick recovery, congestion at the ports will continue to ensure freight remains available until the backlogs are cleared. But, although shifts in the maritime sector happen slowly, shippers’ behavior makes it clear they are leaning more toward the East Coast and divesting their freight from the Ports of Los Angeles and Long Beach.
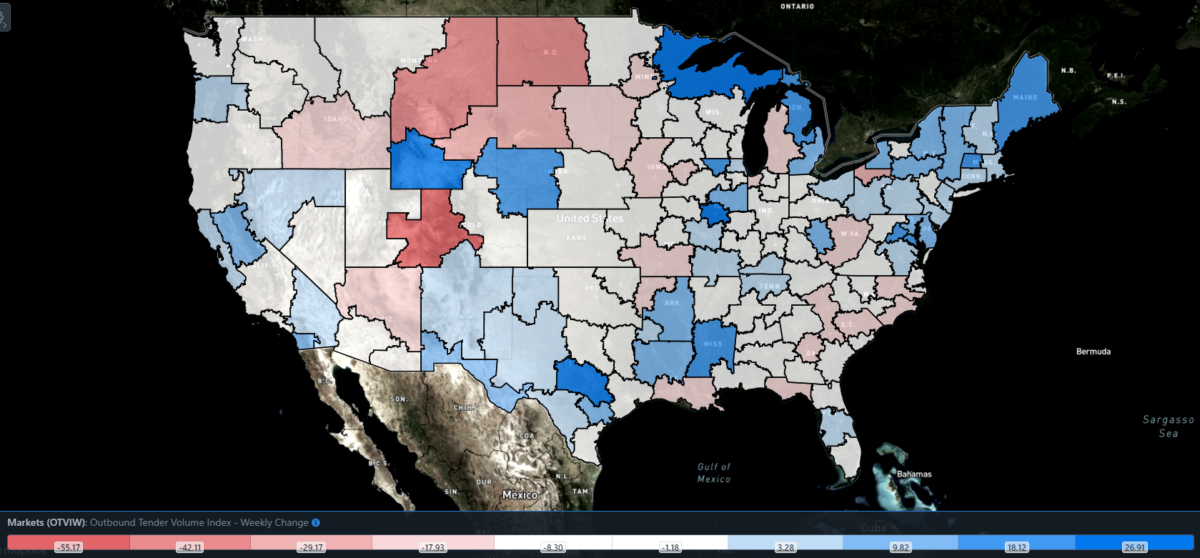
SONAR: Outbound Tender Volume Index – Weekly Change (OTVIW).
To learn more about FreightWaves SONAR, click here.
Case in point: The Georgia Ports Authority reported robust import volumes for July, rebounding from a previous lull in June. Since the fiscal year for the Georgia Ports Authority begins in July, the executive director remarked that it was “the fastest start ever” to a fiscal year. Volumes at the Port of Savannah were up 18% y/y in July. At present, Savannah’s local OTVI has risen 2.4% w/w — far from the largest gain, but still outperforming the overall OTVI.
Of the 135 total markets, 70 reported weekly increases in tender volume. Freight demand is really heating up in the Motor City, with Detroit volumes up 17% w/w. Given the city’s industrial presence, this trend is a blessing to flatbed and less-than-truckload carriers. But even Detroit was beaten by the midl-level outbound market of Austin, Texas, where volumes were up 33.4% w/w
By mode: Reefer and dry van volumes alike are seeing only small gains this week, indicating most of the heavy lifting is being done by flatbeds. The Reefer Outbound Tender Volume Index (ROTVI) is up only 0.64% w/w and down 27% y/y against an inflated ROTVI from last year. The Van Outbound Tender Volume Index is faring slightly better, up 0.85% w/w but down 22.5% y/y.
Rejection rates fall below 6% for the first time since June 2020
Throughout 2019, which was indisputably a recession for the trucking industry, OTRI averaged 6.19%. OTRI’s latest reading puts it comfortably below that average. To make the current figure even more shocking, consider that OTRI began 2022 at 22.5%, whereas 2019 kicked off with OTRI at 14%.
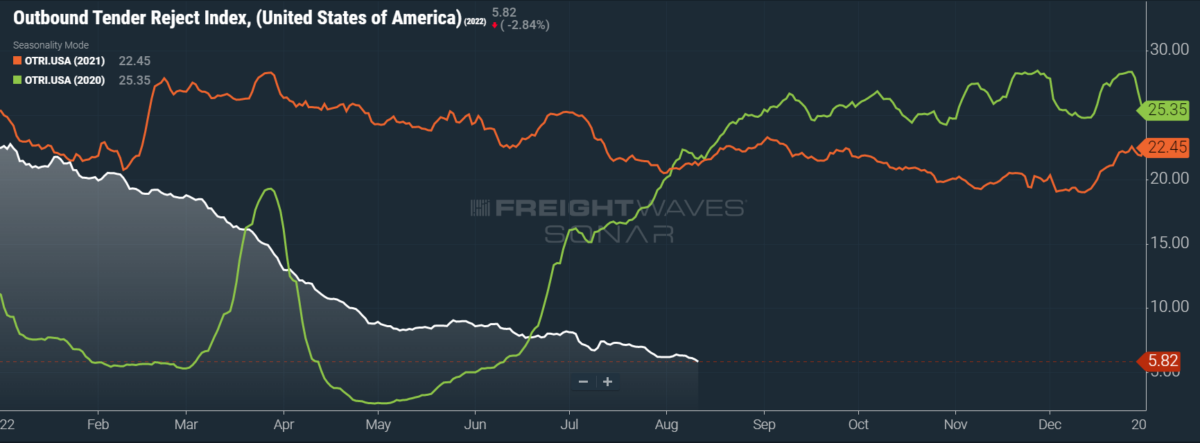
SONAR: OTRI.USA: 2022 (white), 2021 (orange) and 2020 (green)
To learn more about FreightWaves SONAR, click here.
Over the past week, OTRI, which measures relative capacity in the market, fell to 5.82%, a change of 56 basis points (bps) from the week prior. OTRI is now 1,529 bps below year-ago levels.
Further movement on the ongoing legal efforts to delineate independent but leased owner-operators from employees has been made. In July 2020, Eric Brant filed a lawsuit against the large carrier Schneider National, alleging the terms of his contract effectively rendered him an employee — or “company driver” — rather than a leased owner-operator. The latest decision from the 7th U.S. Circuit Court of Appeals has rendered moot any protestations from Schneider, instead finding the terms of the contract were superseded by “the economic reality of the working relationship.”
While many carriers are justifiably concerned about the effects of AB5 — California’s newly enforced independent contractor law — I would argue this case should be viewed as separate from that debate. In my nonlegal view, Brant’s claims are straightforward and the appellate court’s reasoning is solid. Take, for example, Brant’s allegations that he could not reject loads from Schneider and that Schneider could effectively block him (by demanding an unaffordable “security deposit”) from hauling loads under a different carrier.
Taken together, these two allegations undermine the very definition of the leased, independent owner-operator, who is free to reject any offered loads for any reason and is, provided the lease does not (as in the case of Schneider’s) have an exclusivity clause, free to haul loads for other carriers. So, while carriers might be skittish about the potential precedent that the court’s decision could set for AB5-related cases, I argue this case should be viewed solely as the rectification of an improper contract — which is not to say legal precedent cannot be abused.
SONAR: WRI (color)
To learn more about FreightWaves SONAR, click here.
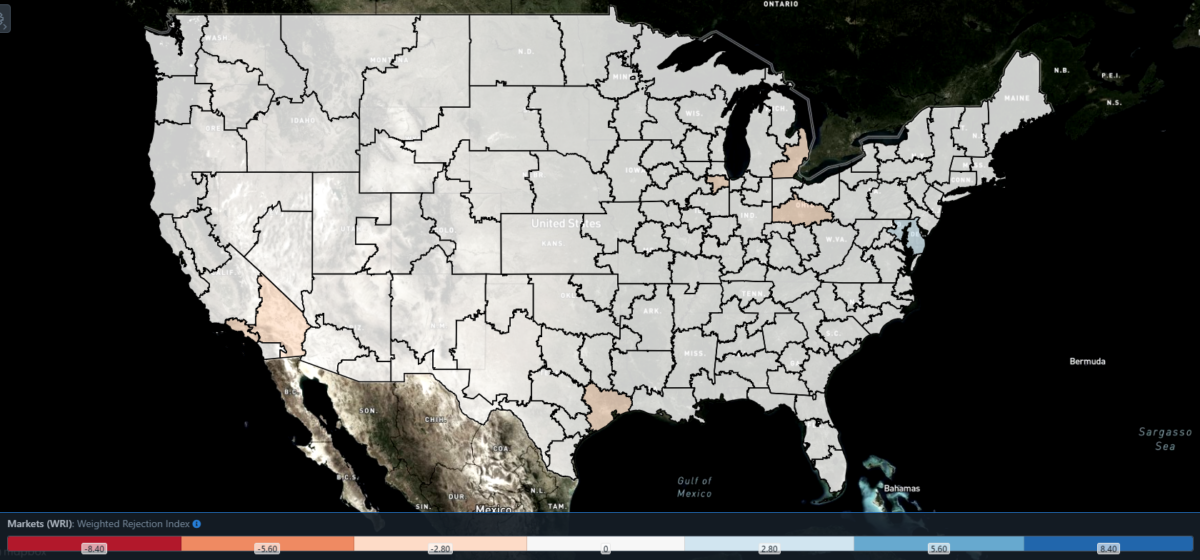
The map above shows the Weighted Rejection Index (WRI), the product of the Outbound Tender Reject Index — Weekly Change and Outbound Tender Market Share, as a way to prioritize rejection rate changes. As capacity is generally finding freight, only Baltimore was a blue market this week, where blue markets are the ones to focus on.
Of the 135 markets, 52 reported higher rejection rates over the past week, though 35 of those reported increases of only 100 or fewer bps.
Baltimore saw its local OTRI jump 406 bps w/w to just shy of 12%, which places the region as having one of the highest rejection rates among the larger markets. Speaking of larger markets, the two heavyweights of Ontario, California, and Atlanta saw downward movement this week. Atlanta, which suffered a collapse in tender rejections during July, saw its local OTRI inch down by 25 bps. Ontario, meanwhile, saw a greater drop of 130 bps.
To learn more about FreightWaves SONAR, click here.
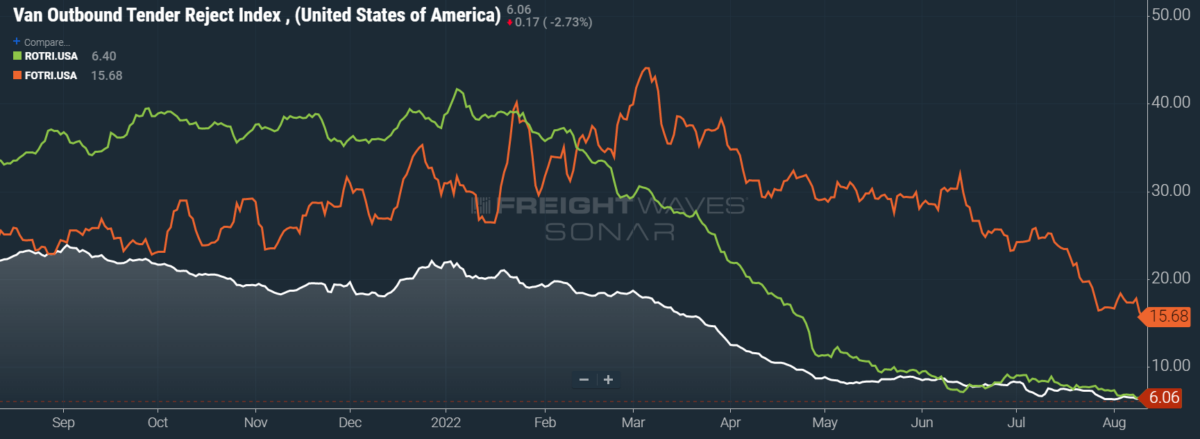
By mode: Despite the overall OTRI edging below 6% this week, rejection rates across the three primary modes — dry van, flatbed and reefer — are all above 6%. To be sure, this week’s OTRI decline was aided by falling tender rejections in all three of these modes, but the hidden driver was intermodal.
The Van Outbound Tender Reject Index fell 57 bps w/w and is now treading water at 6.06%. Reefer rejection rates fell a bit more slowly, as the Reefer Outbound Tender Reject Index dropped only 43 bps w/w to coast at 6.4%. Flatbeds, however, are grim, which spells trouble for the domestic industrial sector. The Flatbed Outbound Tender Reject Index fell 210 bps w/w and is now at 15.68% — its lowest level since February 2021.
Contract rates decline with the rapidity of a tortoise
At this point, I am unsure whether I have become accustomed to (and thus expect) freight metrics collapsing. When I made my callouts for Q3 contract rates, I foresaw them following a trend similar to the National Truckload Index’s (NTI) performance in March, OTRI’s performance in March and OTVI’s performance in — you guessed it — March. Although I was careful to stress that contract rates would not catch spot rates until Q1 2023 (at the earliest), I privately braced myself for a major shockwave on the contract side.
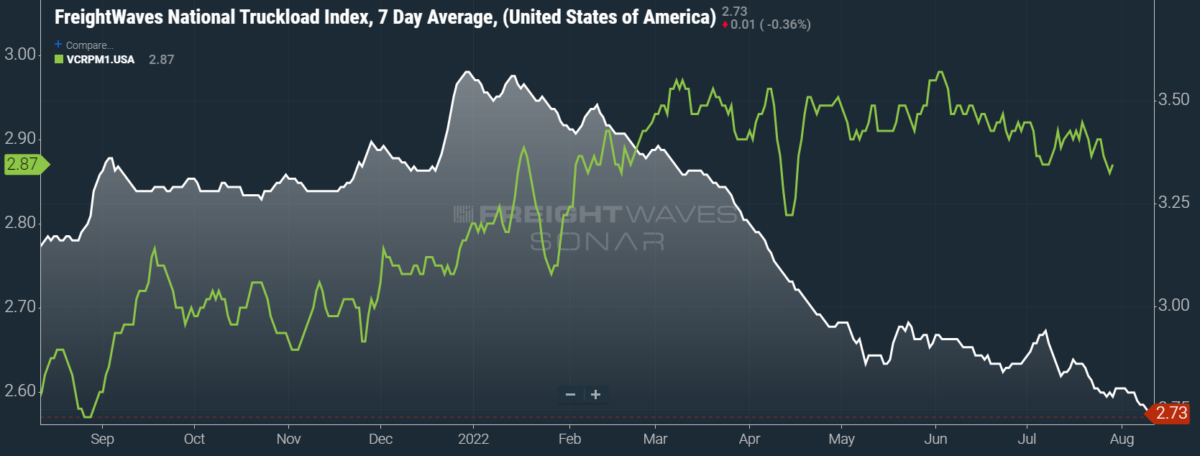
SONAR: National Truckload Index, 7-day average (white; right axis) and dry van contract rate (green; left axis).
To learn more about FreightWaves SONAR, click here.
We are not seeing a shockwave but rather a slow deterioration as contract rates grow more feeble. To be perfectly candid, I would prefer to be proven wrong in spectacular fashion than see this drawn-out slide, as the former would at least be interesting. Instead, contract rates fell by a boring cent per mile w/w to $2.87, recouping another boring cent from the previous day’s low of $2.86 per mile.
Despite this sluggish activity, that low of $2.86 per mile is in fact the lowest contract rates have been since April, when contract rates fell 15 cents per mile in a week and bottomed out at $2.81. With contract rates declining stepwise as they are, it would not be surprising if we see rates stabilize at that level before September ends.
To learn more about FreightWaves SONAR, click here.
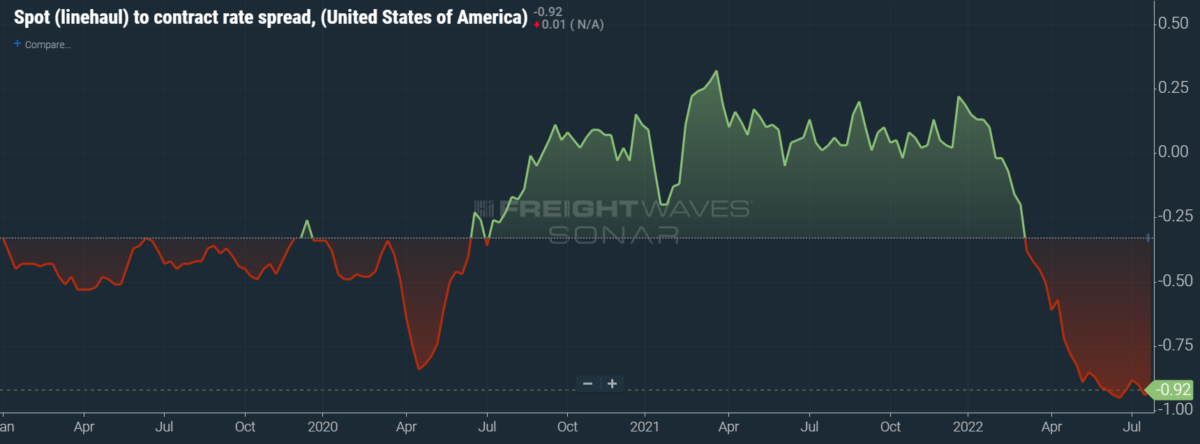
Spot rates, while not boring, are depressing in every sense of the word. Reporting on the NTI seems almost an act of bullying, as it fell 6 cents per mile w/w to $2.73. While some of the decline in spot rates can be attributed to declining prices of diesel fuel, the base linehaul NTI (NTIL) also fell 4 cents per mile to $1.93. The spread between the NTIL and dry van contract rates has widened to minus 92 cents, as seen in the chart above.
To learn more about FreightWaves TRAC, click here.
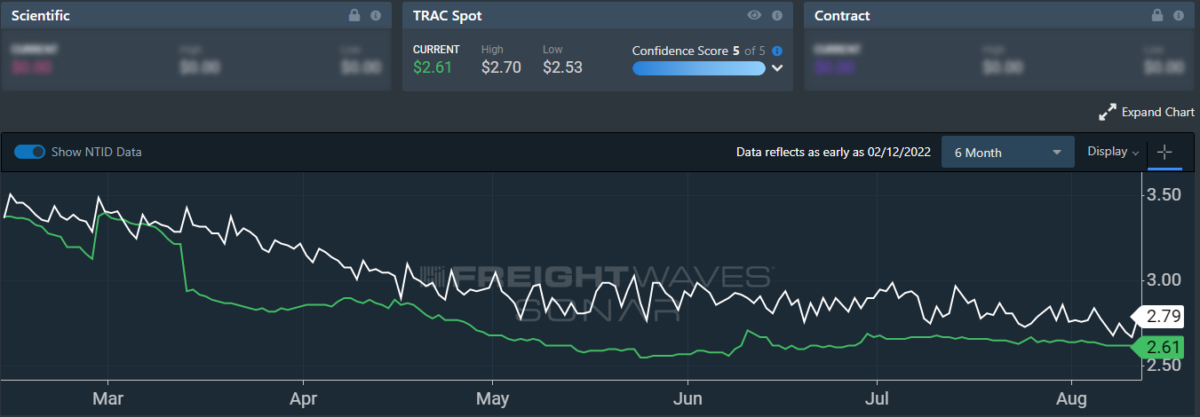
The FreightWaves TRAC spot rate from Los Angeles to Dallas, arguably one of the densest freight lanes in the country, seems to have little room to decline further but is doing so anyways. Over the past week, the TRAC rate fell 3 cents per mile to $2.61. Compared to the NTID, or the National Truckload Index — Daily, rates from Los Angeles to Dallas are lower than the national average, but that was not the case at the start of the year.
When carriers flooded Southern California back in January, they pushed down spot rates rapidly. Depending on how AB5 affects capacity, however, rates may yet go up in the not-so-distant future.
To learn more about FreightWaves TRAC, click here.
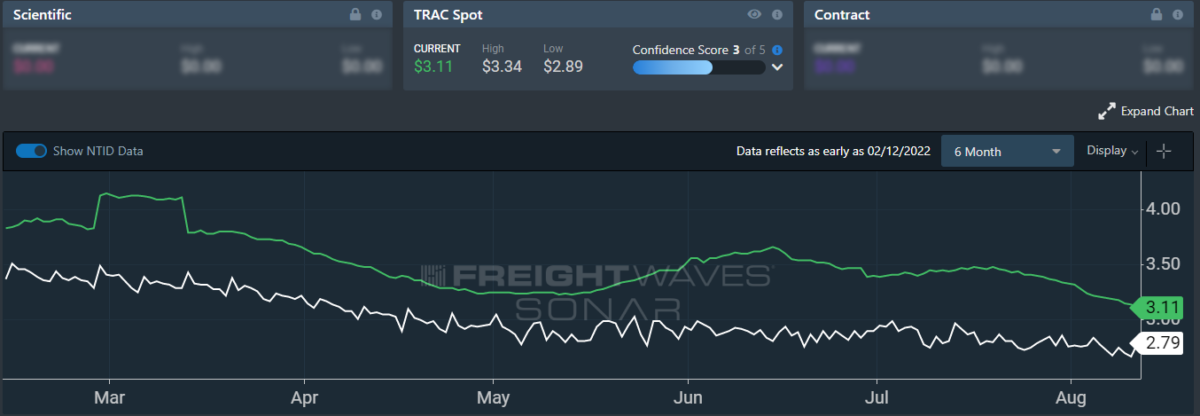
On the East Coast, especially out of Atlanta, rates have suffered a more severe decline but are still beating the daily NTI. The FreightWaves TRAC rate from Atlanta to Philadelphia fell 11 cents per mile this week to reach $3.11. This latest fall compounds the previous week’s drop of 15 cents per mile. Now that diesel prices have stabilized in the Northeast and Philadelphia is posting higher volume, carriers are less reluctant to head north out of the declining (but still robust) Atlanta market.
For more information on the FreightWaves Passport, please contact Kevin Hill at khill@freightwaves.com, Tony Mulvey at tmulvey@freightwaves.com or Michael Rudolph at mrudolph@freightwaves.com.


