


This week’s FreightWaves Supply Chain Pricing Power Index: 35 (Shippers)
Last week’s FreightWaves Supply Chain Pricing Power Index: 35 (Shippers)
Three-month FreightWaves Supply Chain Pricing Power Index Outlook: 40 (Shippers)
The FreightWaves Supply Chain Pricing Power Index uses the analytics and data in FreightWaves SONAR to analyze the market and estimate the negotiating power for rates between shippers and carriers.
This week’s Pricing Power Index is based on the following indicators:
Tender volumes fall, but long-haul volumes gain some momentum
After Hurricane Milton, combined with various retail pushes, generated consumer demand, truckload volumes have retreated over the past week. There shouldn’t be much cause for concern at the moment as imports continue to flow into the ports, especially on the West Coast. Even with the decline over the past week, tender volumes are holding on to year-over-year gains, which should be viewed as a positive sign as 2025 approaches.
To learn more about FreightWaves SONAR, click here.
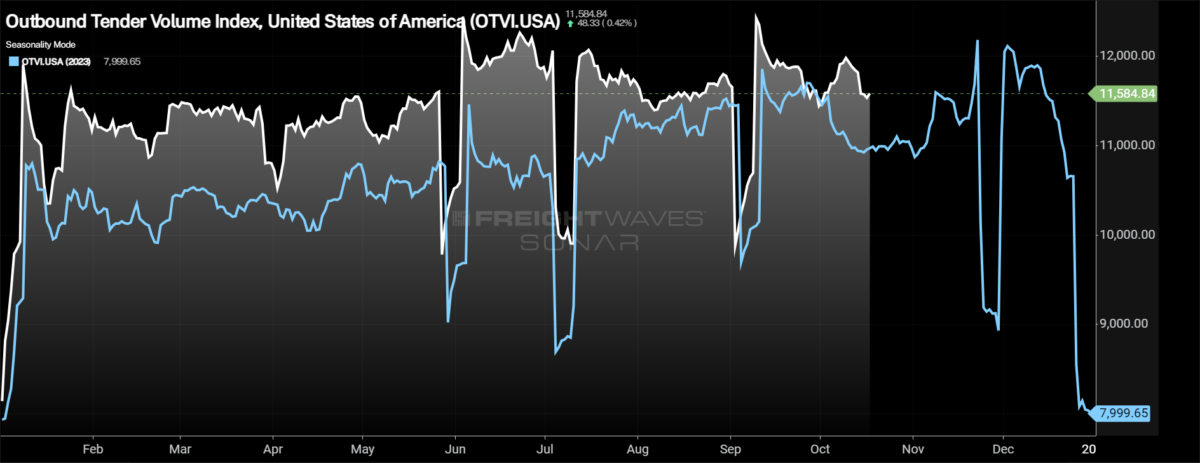
The Outbound Tender Volume Index (OTVI), a measure of national freight demand that tracks shippers’ requests for trucking capacity, erased all of last week’s gain, falling by 2.93% week over week. What hasn’t happened this year is a swift downturn in volumes like what occurred last year. The result is the OTVI is up 5.41% year over year.
The decline in overall tender volumes this week can be attributed to the shorter lengths of haul: loads moving under 250 miles. Both local lengths of haul, loads moving 100 miles or less and short haul, loads moving 100 to 250 miles, fell by more than the overall OTVI, dropping 8.07% and 6.8% w/w, respectively.
If there is a bright spot this week, long-haul volumes started to find some positive momentum. Over the past week, long-haul volumes, loads moving 800 miles or more, increased by 2.38% w/w.
To learn more about FreightWaves SONAR, click here.
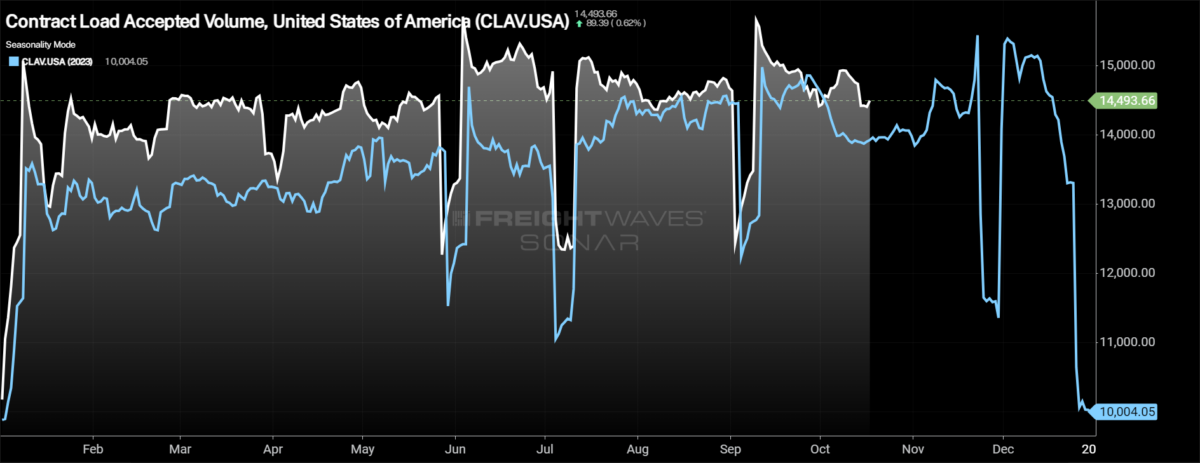
Contract Load Accepted Volume (CLAV) is an index that measures accepted load volumes moving under contracted agreements. In short, it is similar to OTVI but without the rejected tenders. Looking at accepted tender volumes, the decline isn’t quite as significant as total volumes as tender rejection rates declined over the past week. CLAV fell by 2.46% over the past week, but is up 3.81% y/y.
The early stages of October were strong from a consumer spending perspective, according to Bank of America’s card spending report. Total card spending was 0.8% higher y/y in the week ending Oct. 12. Online retail was up 4.3% y/y, likely a result of the retail pushes like Amazon’s Prime Deal Days and Target’s Circle Week. Transit and gas spending were under pressure, falling 1.4% and 11.7%, respectively. BofA attributes the declines to Hurricane Milton impacts, though the bank highlights that spending outside of Florida “remained solid.”
To learn more about FreightWaves SONAR, click here.
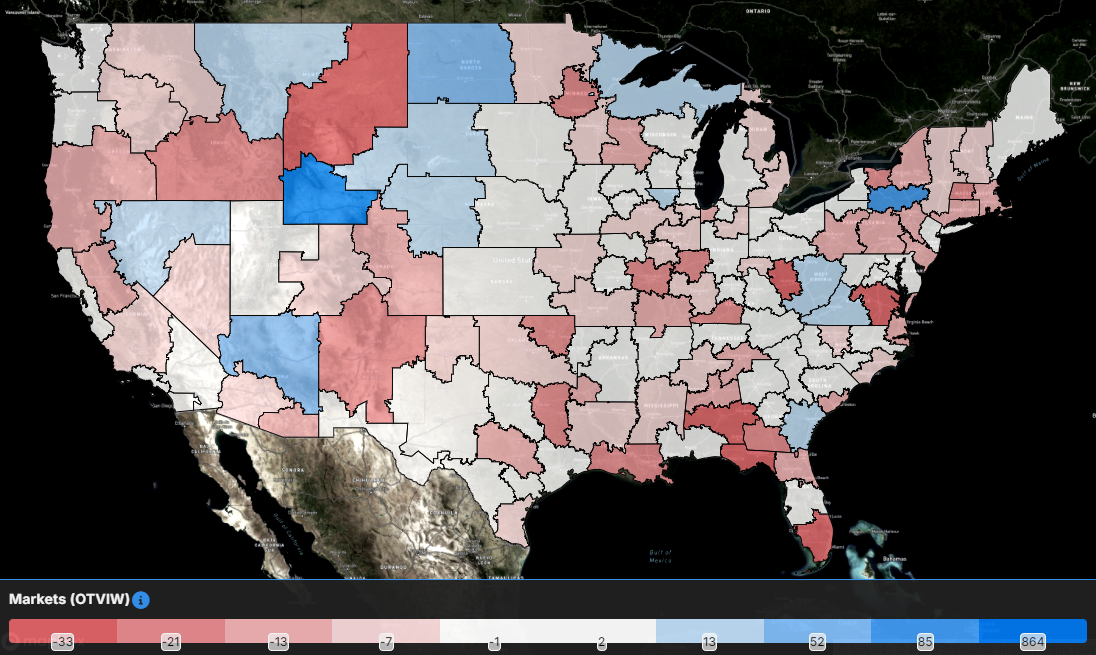
With the decline in freight demand overall, the majority of the freight markets across the country experienced lower volumes on a week-over-week basis. Of the 135 freight markets tracked within FreightWaves SONAR, 51 had higher volumes compared to last week, down from 81 in the week prior.
Even with the decline, the positive signs are that three of the largest freight markets in the country saw volumes grow over the past week. Tender volumes in both Ontario, California, and Atlanta increased over the past week, rising 1.7% and 1.76%, respectively. The Chicago market fared even better as tender volumes increased by 3.48% w/w.
Not all the large freight markets fared so well. The Dallas market had one of its worst weeks from a volume perspective this week, as tender volumes fell by over 16%. At the same time, the Harrisburg, Pennsylvania, market saw volumes decline by 9.54%.
To learn more about FreightWaves SONAR, click here.
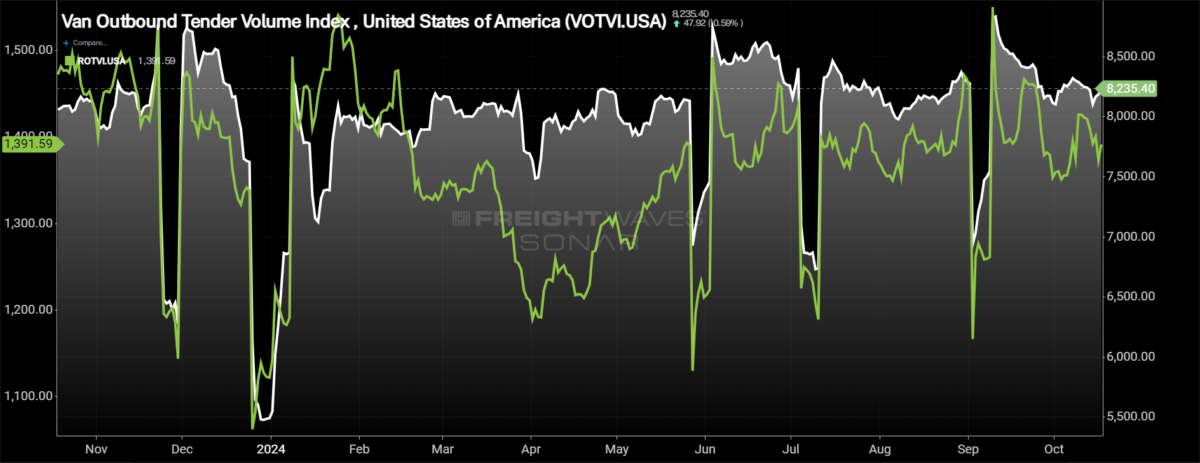
By mode: Dry van volumes held up better than the overall market as the decline in volumes isn’t quite as concerning. The Van Outbound Tender Volume Index fell by 0.4% over the past week. Dry van volumes are 2.18% higher than they were this time last year.
The reefer market, on the other hand, experienced a larger slowdown, likely due to Hurricane Milton’s impact on the Lakeland, Florida, market, one of the larger reefer markets by outbound volume. The Reefer Outbound Tender Volume Index fell by 2.41% over the past week and is 5.49% lower y/y.
Rejection rates fall, barely holding on to 5%
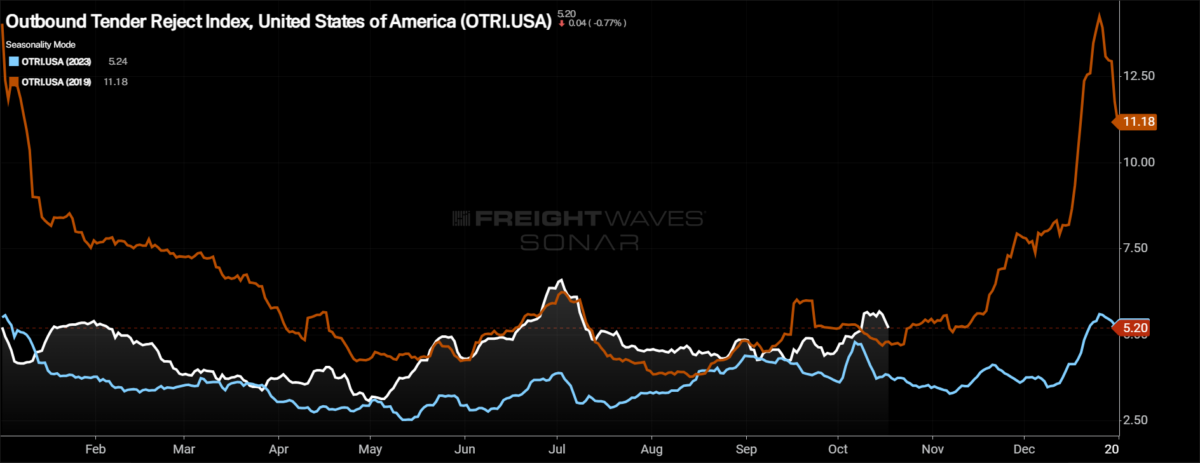
Tender rejection rates are coming off the recent spike associated with both Hurricane Milton and the International Longshoremen’s Association strike. The retreat from the recent highs hasn’t been as quick as with other disruptions this year. Tender rejection rates are holding above 5% for the time being.
To learn more about FreightWaves SONAR, click here.
Over the past week, the Outbound Tender Reject Index (OTRI), a measure of relative capacity, decreased by 46 basis points to 5.2%, not eliminating all of last week’s increase. The OTRI is now 146 basis points above last year’s levels. If tender rejection rates are able to hold above 5% through the last two weeks of October, it sets up for a more “normal” peak season, with tender rejection rates peaking above 10% around the holidays.
To learn more about FreightWaves SONAR, click here.
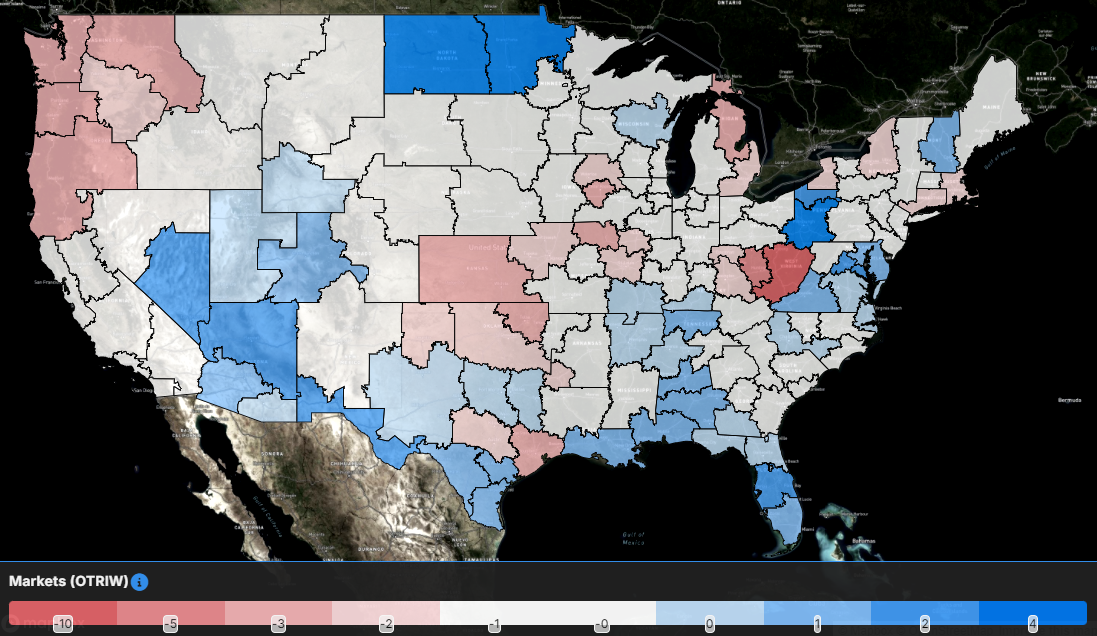
The map above shows the Outbound Tender Reject Index — Weekly Change for the 135 markets across the country. Markets shaded in blue are those where tender rejection rates have increased over the past week, whereas those in red have seen rejection rates decline. The bolder the color, the more significant the change.
Of the 135 markets, just 40 reported higher rejection rates over the past week, a decrease from 90 that experienced increases in last week’s report.
Capacity is quickly returning to the largest freight markets in the country to ensure asset utilization remains strong. The result: Tender rejection rates in the largest markets declined over the past week. In Ontario, rejection rates declined by 117 bps while they were 130 bps lower in Atlanta.
Capacity moved back into the Pacific Northwest over the past week as rejection rates in Seattle fell by 272 bps. It wasn’t only Seattle where rejection rates fell over the past week in the region. In Spokane, Washington, tender rejection rates fell by 278 bps, and in Medford, Oregon, rejection rates dropped by 289 bps.
To learn more about FreightWaves SONAR, click here.
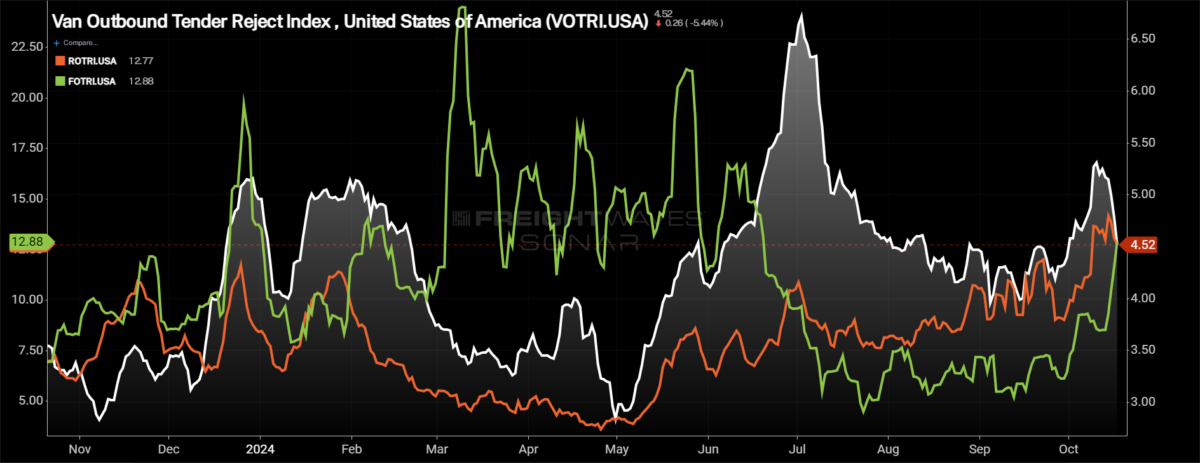
By mode: Dry van capacity has been harder to disrupt for periods of time throughout this year, a result of the market continuing to be oversupplied. As a result, the Van Outbound Tender Reject Index fell by 79 basis points over the past week to 4.52%. Even with the decline, van rejection rates are 103 bps higher than they were this time last year.
The reefer market took a breather this week as rejection rates fell from their recent highs. Over the past week, the Reefer Outbound Tender Reject Index fell by 85 bps to 12.77%. Compared to this time last year, the reefer rejection rate is 549 bps higher.
As the recovery and rebuilding stages of hurricane relief are firmly underway throughout the Southeast, the flatbed market is seeing a flurry of activity. The Flatbed Outbound Tender Reject Index increased by 430 bps over the past week to 12.88% as flatbed rejection rates are finally back above 10%. Compared to this time last year, flatbed rejection rates are more than double, up 662 bps y/y.
Spot rates inch higher, likely a reaction to higher rejection rates last week
It has taken more than a week for spot rates to react to the increases in rejection rates, but spot rates did finally inch higher this week. Now, the increase isn’t anything to write home about because it was just 2 cents per mile on the national level, but it is better than further declines that test the May lows.
To learn more about FreightWaves SONAR, click here.
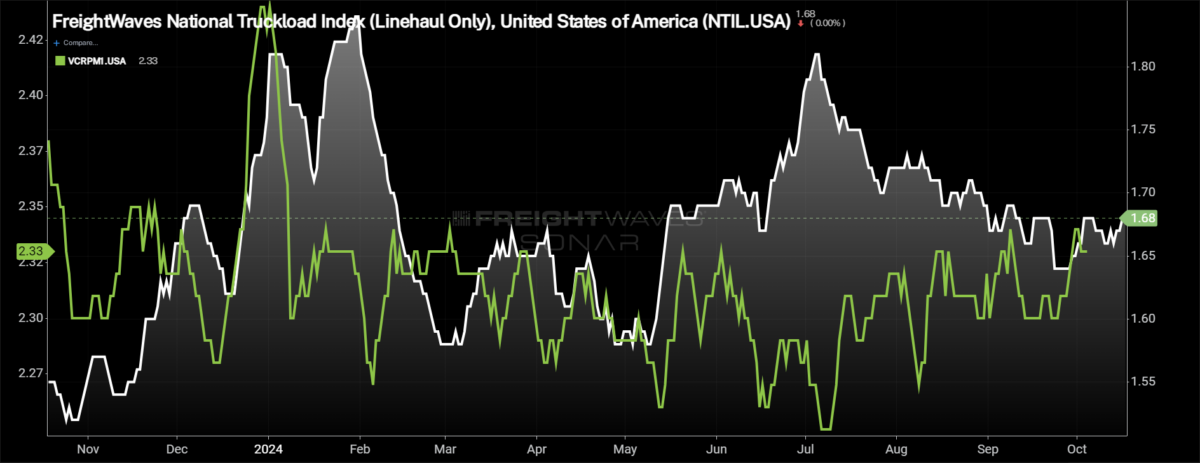
This week, the National Truckload Index — which includes fuel surcharge and various accessorials — rebounded ever so slightly, rising by 2 cents per mile to $2.24. With that increase, the NTI is unchanged from where it was this time last year, but there has been volatility over the past year. The linehaul variant of the NTI (NTIL) — which excludes fuel surcharges and other accessorials — increased in line with the overall NTI, a sign that fuel prices didn’t have an impact on spot rate direction this week. The NTIL rose by 2 cents per mile to $1.68. In a positive sign for those participating in the spot market, the NTIL is 13 cents per mile higher y/y, an indication that overall rates are moving higher. The reason the NTI is flat despite the upward move in the NTIL is that diesel prices are much lower than they were this time last year. The average diesel truck stop price is 84 cents per gallon, or 18.62%, lower y/y.
Initially reported dry van contract rates, which exclude fuel, have been in a tight range all year. The lows of contract rates have started to move higher in recent months, an indication that there is likely to be contract rate inflation in the coming months as the range starts to move higher. Over the past week, the initially reported contract rate rose by 2 cents per mile to $2.33. The initially reported contract rate is just 2 cents per mile, or 0.85%, lower than it was this time last year. For reference, at the beginning of May, the initially reported contract rate was nearly 7% lower y/y.
To learn more about FreightWaves SONAR, click here.
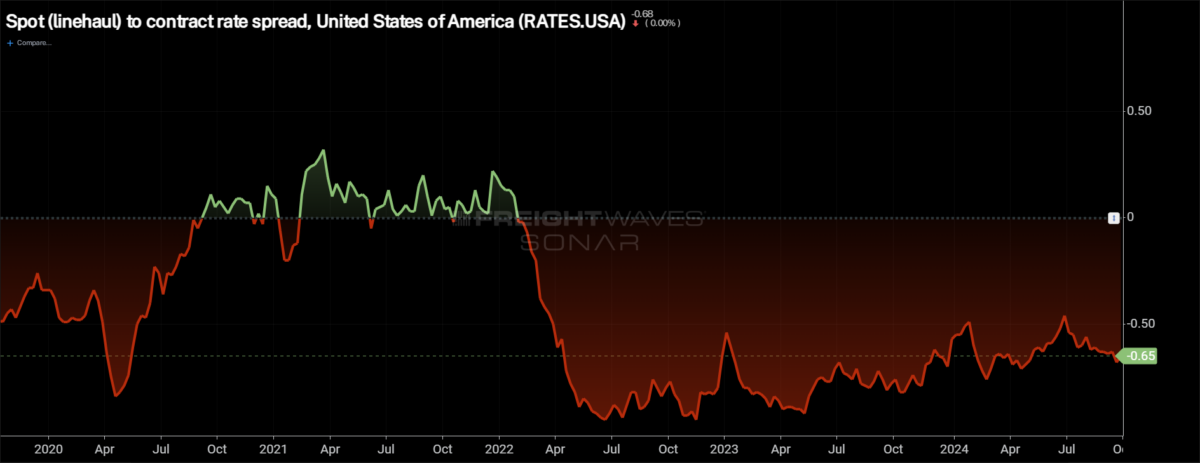
The chart above shows the spread between the NTIL and dry van contract rates is trending back to pre-pandemic levels. The spread remains historically wide and has actually widened in recent weeks, diverting from the pre-pandemic average that it had been inching closer to throughout the year. Significant disruptions can quickly tighten the spread as spot rates react much faster, so seeing a narrowing of the spread in the fourth quarter, during truckload peak season, wouldn’t be a surprise. The question is how significant the narrowing is and whether it is sustainable, especially if the first quarter of 2025 is the traditionally soft period for freight demand.
To learn more about FreightWaves TRAC, click here.
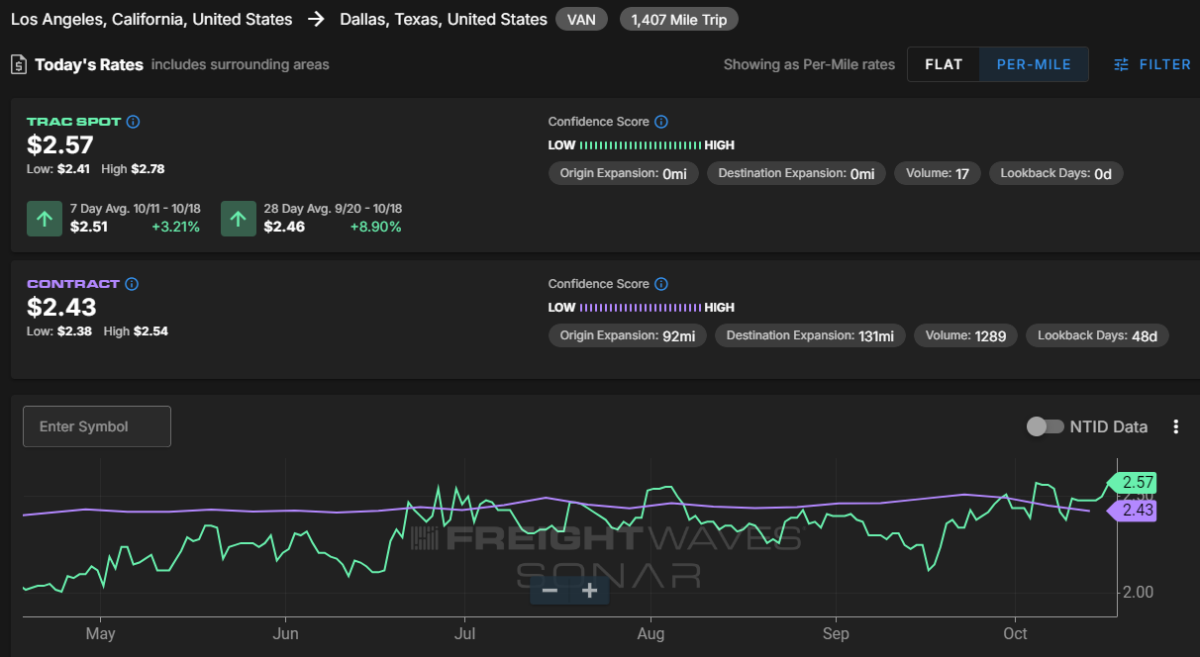
The FreightWaves Trusted Rate Assessment Consortium spot rate from Los Angeles to Dallas continues to have some positive momentum. The TRAC rate from Los Angeles to Dallas increased by 8 cents per mile to $2.57. Spot rates have now been above contract rates for much of October – 14 cents per mile higher at present.
To learn more about FreightWaves TRAC, click here.
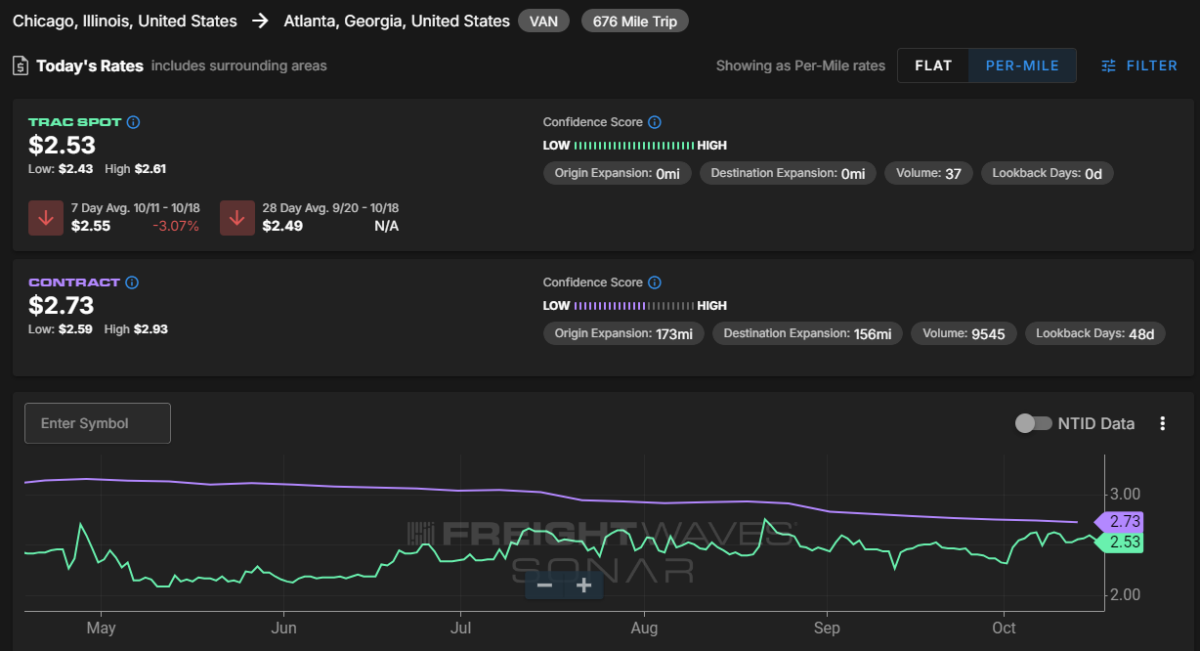
From Chicago to Atlanta, spot rates have been holding on to some gains to start October but gave some back over the past week. The FreightWaves TRAC spot rate along this lane fell 8 cents per mile to $2.53, now just 20 cents per mile below the contract rate.