FREIGHTWAVES’ SONAR CHART OF THE WEEK (August 26-Sept 1, 2018)
Chart of the Week: Outbound Tender Rejection Index for the USA (OTRI.USA)
Outbound Tender Rejections for the USA (SONAR: OTRI.USA). This index measures the total percent of electronically tendered loads that have been rejected. It is an indication of the discretion that carriers have over which loads they want to accept from shippers.Carriers and brokers have been a little uneasy of late with August being such a slow month. We have heard from panicked carriers and brokers that turn-downs (loads that are rejected from shippers) are at their lowest point in over a year. This isn’t just an emotional reaction: the data suggests that this is the case. Turn-downs (or as we call them: tender rejections) are at a 2018 low, according to our SONAR data.
SONAR’s OTRI.USA ticker is showing 17.16% of all tenders (as of Aug 24th) are being rejected in the trucking market. This is the lowest level of the year. The lowest level before this was 17.31% set on August 13.
The good news for carriers is that the bottom appears to be really close. We have been looking for a “double-bottom” for a few weeks and this could be it. There is certainly good reason to believe that the bottom is close.

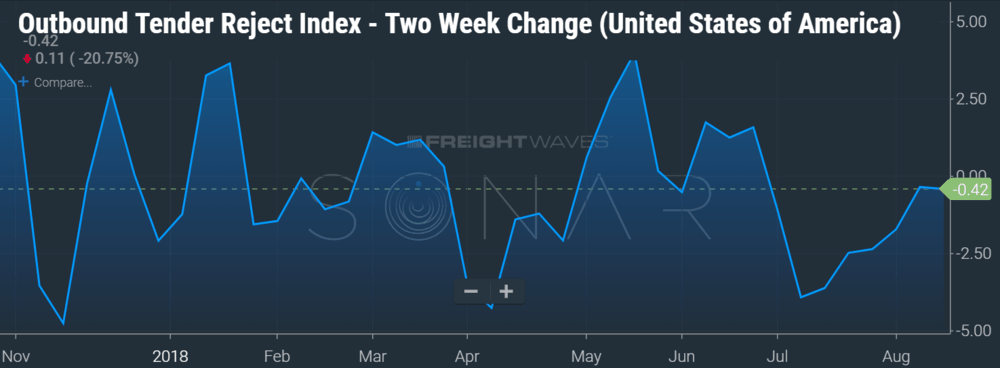
The two-week delta chart (OTRIF.USA), also in SONAR, that tracks tender rejection movement changes over time is starting to show a more bullish pattern and has been since July 8th, when the chart bottomed at -3.93. The OTRIF.USA is currently sitting at .42%. If this breaks above zero, it is in an indication that carriers are starting to gain load selection power over the market yet again.

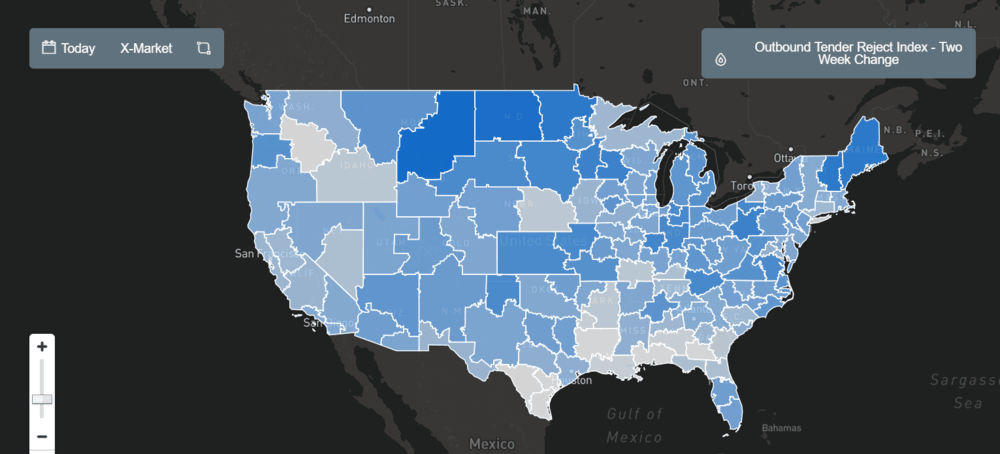
The national OTRIF map is also showing a darker blue in many markets, meaning that tender rejections are starting to pick up in those areas of the country. It just hasn’t hit the high volume markets to move the entire USA, just yet.
What does this all mean? We believe that we are almost out of the woods and the summer slump is behind us. We called a bottom two weeks ago off the West Coast. We believe that the rest of the market should show signs of life this coming week going into the holiday.
About Indices presented in this article
(OTRI.USA) Outbound tender rejection index measures the total amount of electronic loads rejected in the freight market. OTRI is a great indicator to understand the ability for carriers to enjoy optionality in their freight selection. Higher optionality means that carriers will enjoy higher quality loads at higher rates. Lower optionality means that carriers will have to take lower quality freight at lower prices.
(OTRIF.USA) Outbound tender rejection index fortnight (or two-week change). Measures the change in outbound rejections in the market, compared from two weeks ago. This is a great way to understand how the sentiment and direction is changing in the market. A lower number on this will indicate deteriorating conditions vs. two weeks prior.
About Chart of the Week
The FreightWaves Chart of the Week is a chart selection from SONAR that provides an interesting data point to describe the state of the freight markets. A chart is chosen from thousands of potential charts on SONAR to help participants visualize the freight market in real-time. Each week the Sultan of SONAR will post a chart, along with commentary live on the front-page. After that, the Chart of the Week will be archived on FreightWaves.com for future reference.
SONAR aggregates data from hundreds of sources, presenting the data in charts and maps and providing commentary on what freight market experts want to know about the industry- in real time.
The FreightWaves data-science and product teams are releasing new data-sets each week and enhancing the client experience.
To find out more about SONAR go here or to setup a demo click here.


