


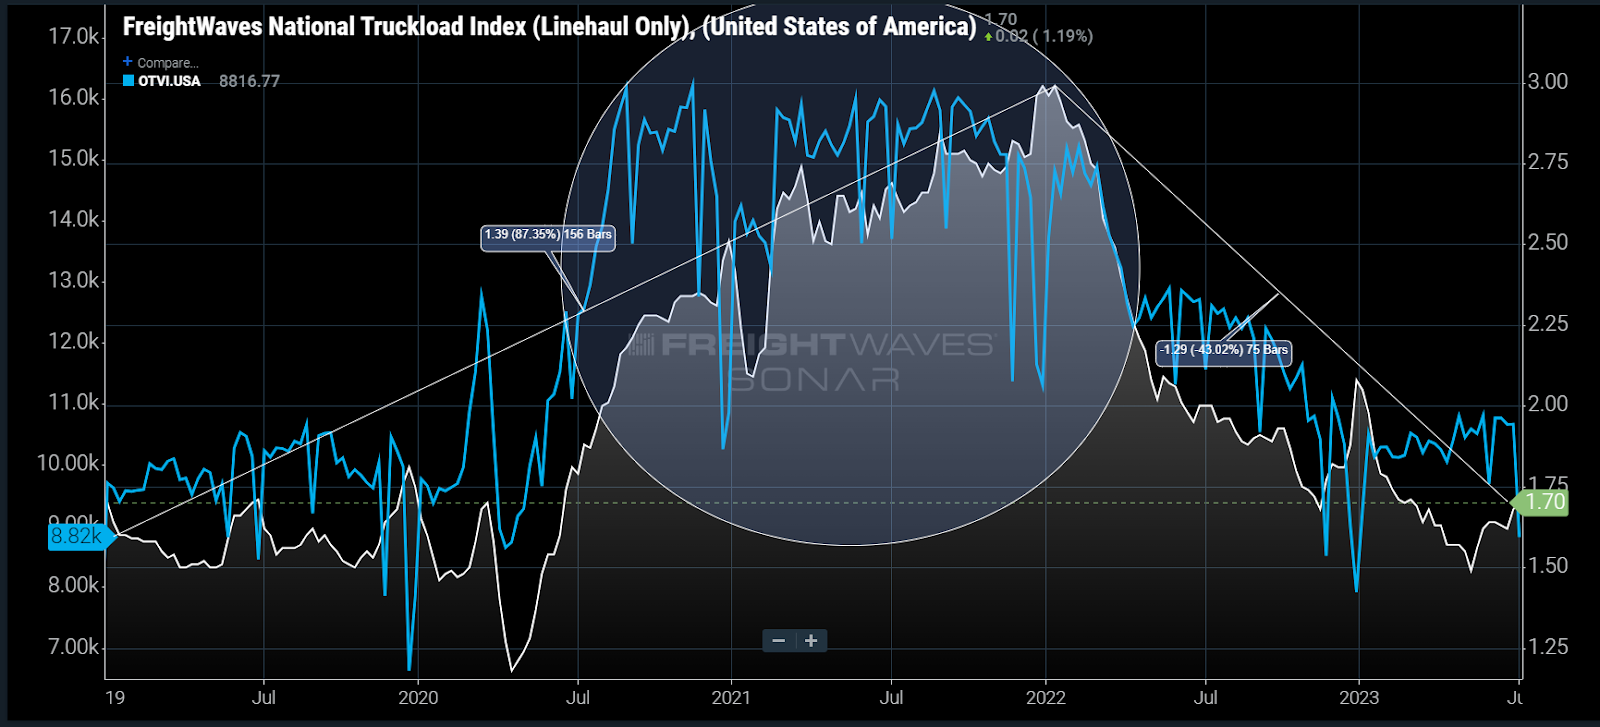
Chart of the Week: National Truckload Index Linehaul Only, Outbound Tender Volume Index – USA SONAR: NTIL.USA, OTVI.USA
Truckload spot rates excluding estimated fuel costs are up ~13% since early May with truckload tender volumes up 7% since the start of the year, though still a shadow of what they were in 2021. Is the freight market finally recovering from its post pandemic hangover or is this simply a seasonal bump of false hope?
The answer to both questions is yes. The fact there is any semblance of seasonal movement instead of a continuous downward trend is a sign that the freight market is stabilizing, but it is not definitive evidence that supply and demand have rebalanced.
Rates are noisy
Spot rates are a culmination of multiple factors. At their simplest they measure the fair market value for moving a truckload in a given lane. That value tends to increase around the holidays as shippers have narrowing service windows and carrier availability becomes increasingly limited.
At times, the simple fact that many people expect rates to become more expensive can inflate the market without capacity actually tightening meaningfully. This occurs due to the lack of transparency, where neither shippers, brokers nor carriers have a complete view of the market.
Carrier costs are also a component of the rate. While the direct costs like labor and equipment are easier to estimate from an outside perspective, the network component driven by their unique customer footprint makes them less understandable.
For instance, a carrier may have more freight moving out than into the Houston market thanks to a large customer. This leads it to offer rates that are lower than market average (or even direct costs) into the Houston area so it can win more business and cover its obligations.
Losing this account would change the way the carrier prices freight into Houston. This is currently happening on a larger scale in the U.S.
As demand patterns have shifted post-pandemic, carrier networks are also in flux. The epicenter of the freight boom was in Southern California. Carriers priced loads moving into this region more cheaply than others to help position their trucks.
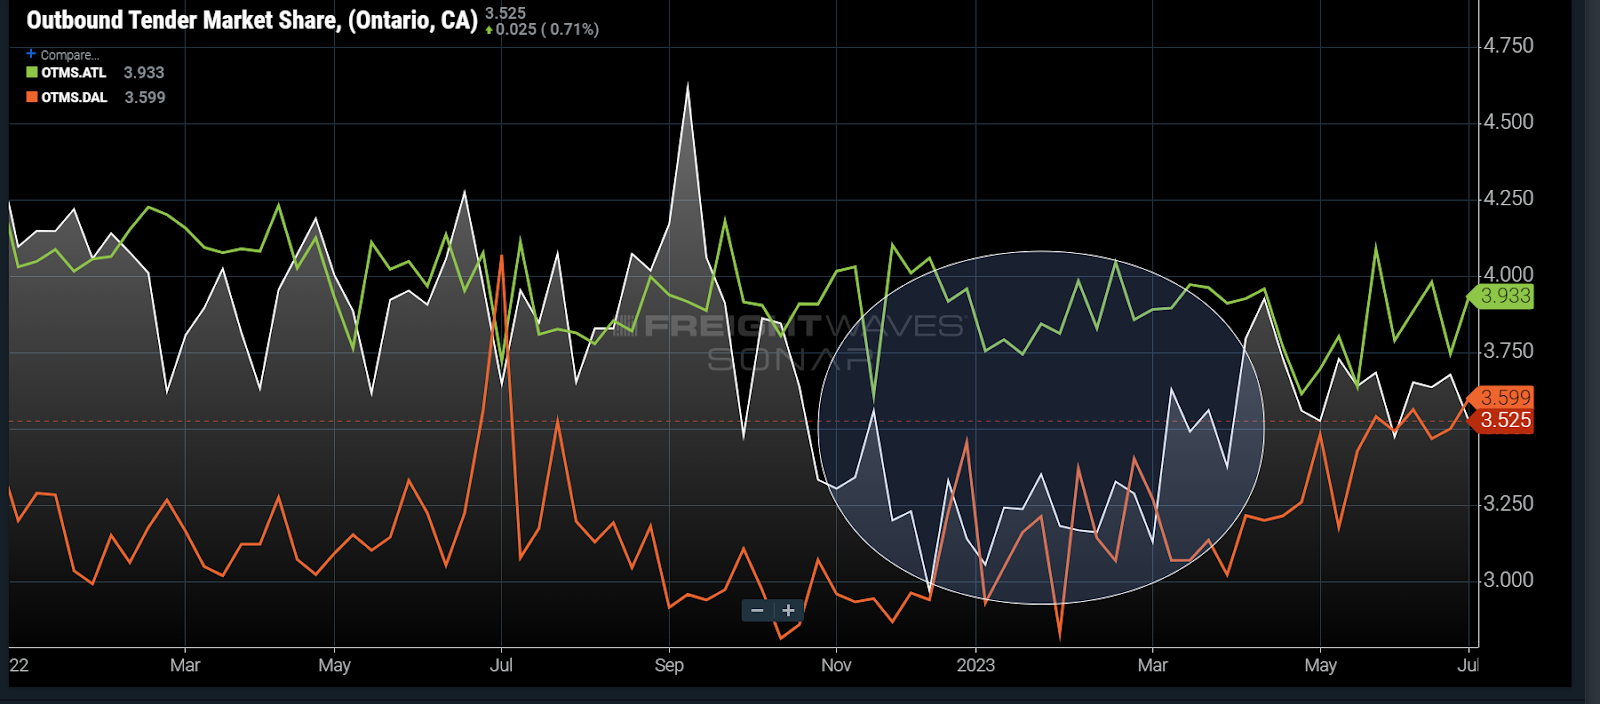
Ontario, California’s outbound market share fell from 4.25% at the beginning of 2022 to near 3% at the end of that year while Atlanta has remained relatively flat and Dallas has grown.
Demand has fallen more sharply out of Southern California than many of the larger Eastern markets, leaving freight contracts underpriced heading out West. Pair that with a relatively low amount of freight moving in that direction and you get less capacity in the region, exposing it to more price fluctuations.
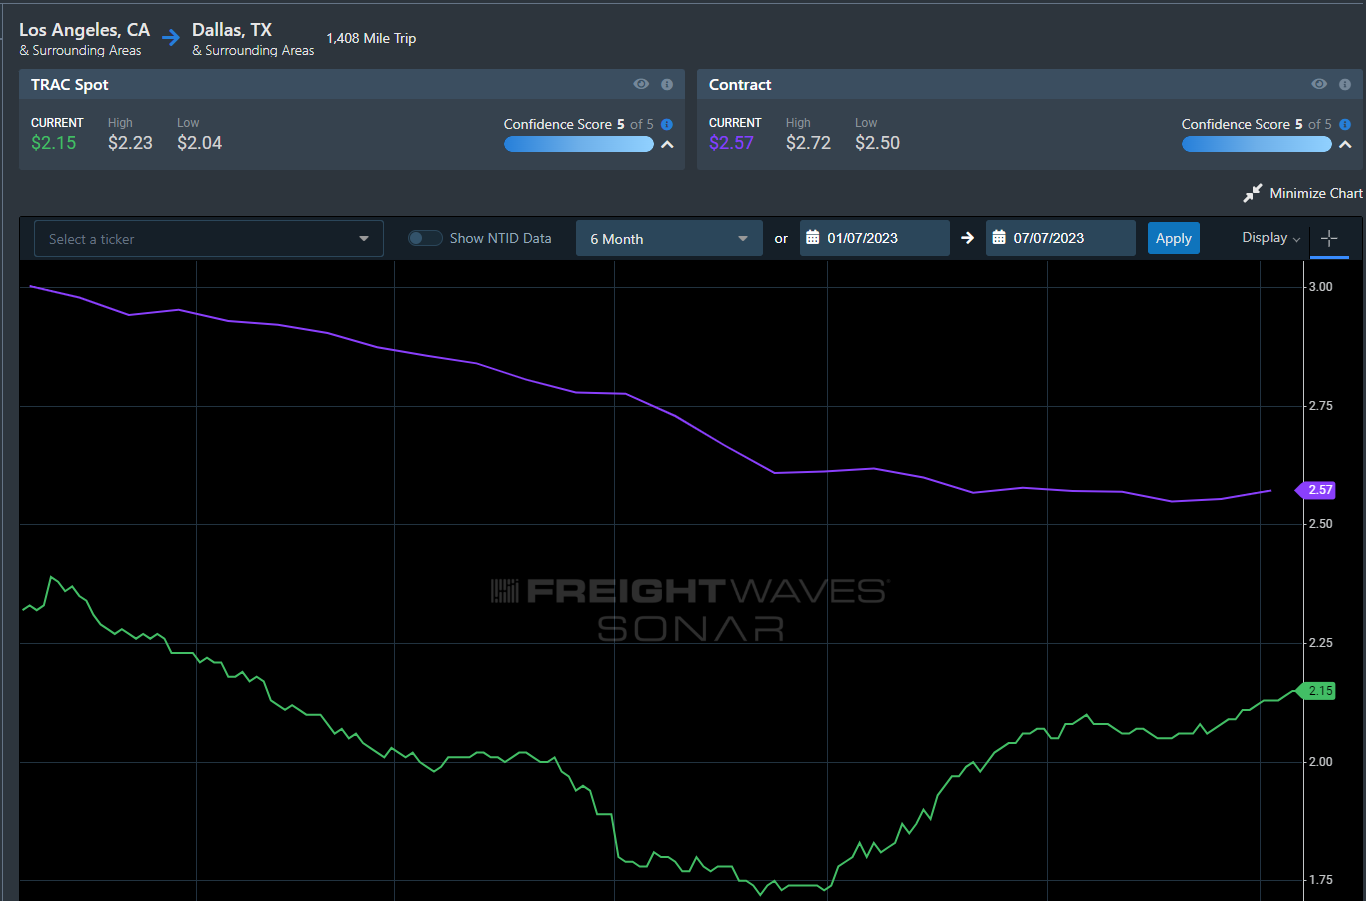
The current spot rate from Los Angeles to Dallas according to FreightWaves TRAC is $2.15 per mile — up 23% from May 1. The near-term increase is impressive, but rates are still well below contract and 20% lower than last year. There is a rebalancing act taking place that is pushing rates back into equilibrium.
Demand seems stable
The national Outbound Tender Volume Index (OTVI), a measure of shipper requests for truckload contract capacity, has been trending higher since January and is following a semblance of a seasonal pattern that existed prior to 2020.
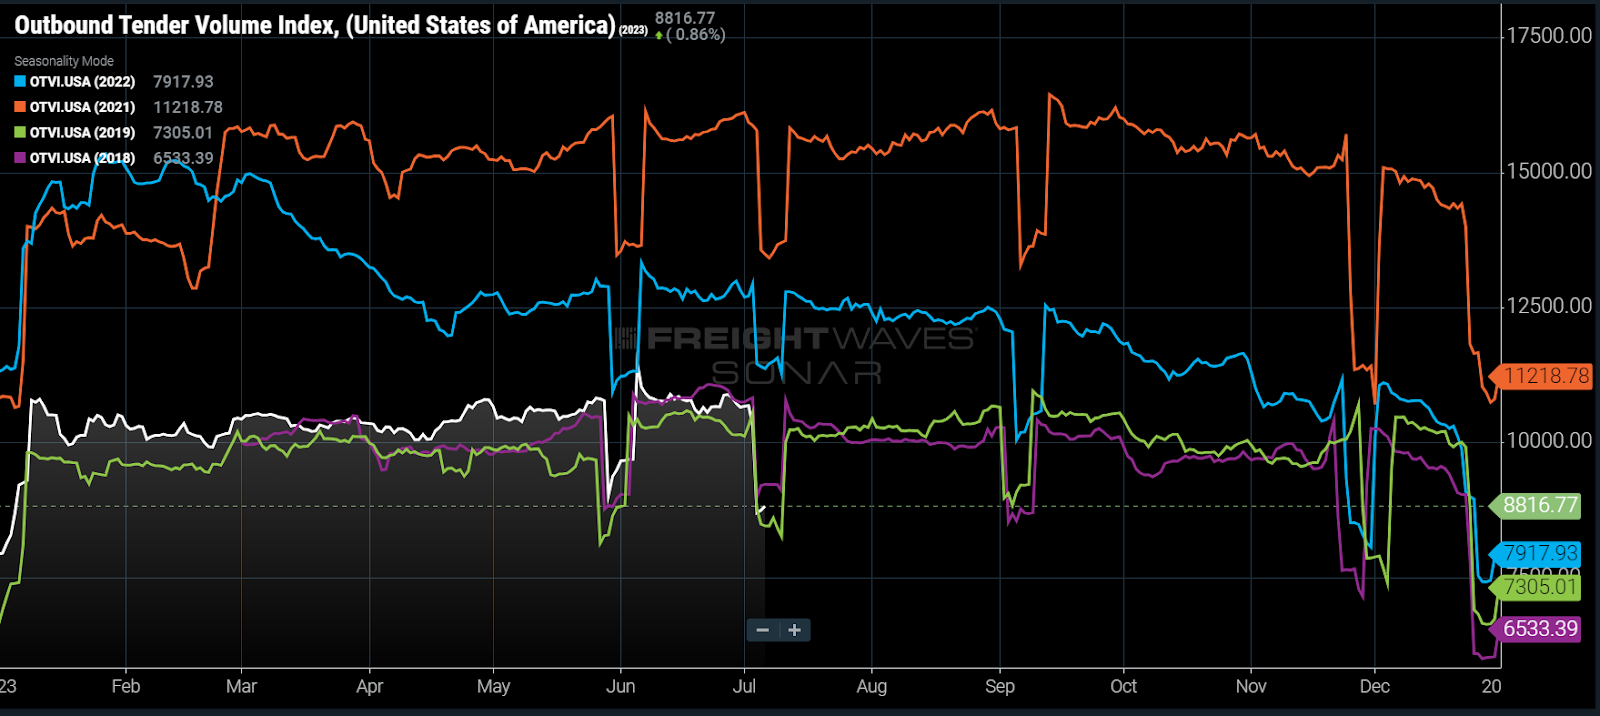
Comparing 2023 to pre-pandemic 2018 (purple) and 2019 (green), spring demand came and sustained earlier than usual. Another takeaway is that the market can expect demand to ease to an extent in July without cause for alarm.
The main takeaways as we close the first half of 2023 are that the market has found a demand floor and there is no strong evidence that spot rates will sustain their trend beyond the typical summer seasonality bump. The Western regions are tightening, but this will smooth out as pricing aligns. The majority of the bubble has burst but capacity is still due for a strong correction.
About the Chart of the Week
The FreightWaves Chart of the Week is a chart selection from SONAR that provides an interesting data point to describe the state of the freight markets. A chart is chosen from thousands of potential charts on SONAR to help participants visualize the freight market in real time. Each week a Market Expert will post a chart, along with commentary, live on the front page. After that, the Chart of the Week will be archived on FreightWaves.com for future reference.
SONAR aggregates data from hundreds of sources, presenting the data in charts and maps and providing commentary on what freight market experts want to know about the industry in real time.
The FreightWaves data science and product teams are releasing new datasets each week and enhancing the client experience.
To request a SONAR demo, click here.

Gayle
I own a small freight brokerage, I agree with every carrier comment on here. (I have also owned a trucking company so I get this) It is literally dog eat dog out here in broker world too. My business is down at least 35%, and I lost a major customer this year as well. The reason is that I refuse to pay trucks a rate I know they can’t make a profit with. There are cut throat brokerages banging on every single one of my customers doors non stop. I was in trouble with a customer just today for giving my NC to IN truck 2.41 a mile. I explained to them that fuel has went up some places this week almost .30 cents and a carrier just sent me a text showing diesel pushing another 7 cents up tonight. Don’t lump all the brokers together. I don’t even post my loads any longer due to cargo theft that is insane right now. I call carriers I know, who I see posted on the boards and go that route. I would suggest to carriers, stay close to brokerages you have worked with long term and have a relationship with. Post yourself on DAT, because there are brokerages out there like me who are looking for you. I am selling my carriers service, dependability, safety of cargo, etc to my customers daily. Myself, and other small brokerages, understand without you, no one has a job. And when you are looking at loads, remember to figure in all of your expenses – No one is in business to break even!!!
Marc
Great Replacement Theory. Increasing demand on housing sector while sky high inflation with unlimited immigration. All I see is foreign born Drivers in white beat up Volvos with their company mc# on a piece of paper taped to the side of the truck. There’s your problem. No Country can stand 1 million plus immigration a year.
Dan walsh
Rates keep going down and the truckers are the only ones to blame. When you see O/0 running loads for 1.30 a mile, covering over 1500, plus miles that’s insanity, brokers still get their money and OO keep fighting among themselves for peanuts. Then, those same dudes running for a meager pay can’t afford to fix their trucks, pay their insurance cost. I have put two of my trucks out of service till the market changes, but this looks like another wasted year. Hope truckers wake up and understand how much money it takes to run a truck.😔🙏🙏
Patrick Taylor
This is all truly sad. Owner of TaylorMade. PT GO TRUCKERS AND SO NO TO CHEAP FREIGHT. PT P.S they deleted my first comment-what a joke.